ERP for manufacturing through the eyes of a young developer. Part 1
My name is Nikolai, and I’m 21. About two months ago, I was asked for the first time to help build a large-scale digital product: an ERP system for a motor oil plant. It was almost like a very big university assignment, except that instead of a grade, there was a real business, real money and several hundred products on the line. A big project and a great chance to prove myself. A real plant with lots of data, a complex architecture and integration with 1C (the leading accounting and ERP platform in Russia and the CIS). It sounded like the kind of job that would let me say, with complete confidence, that I had tamed complex processes and brought structure to them in record time.
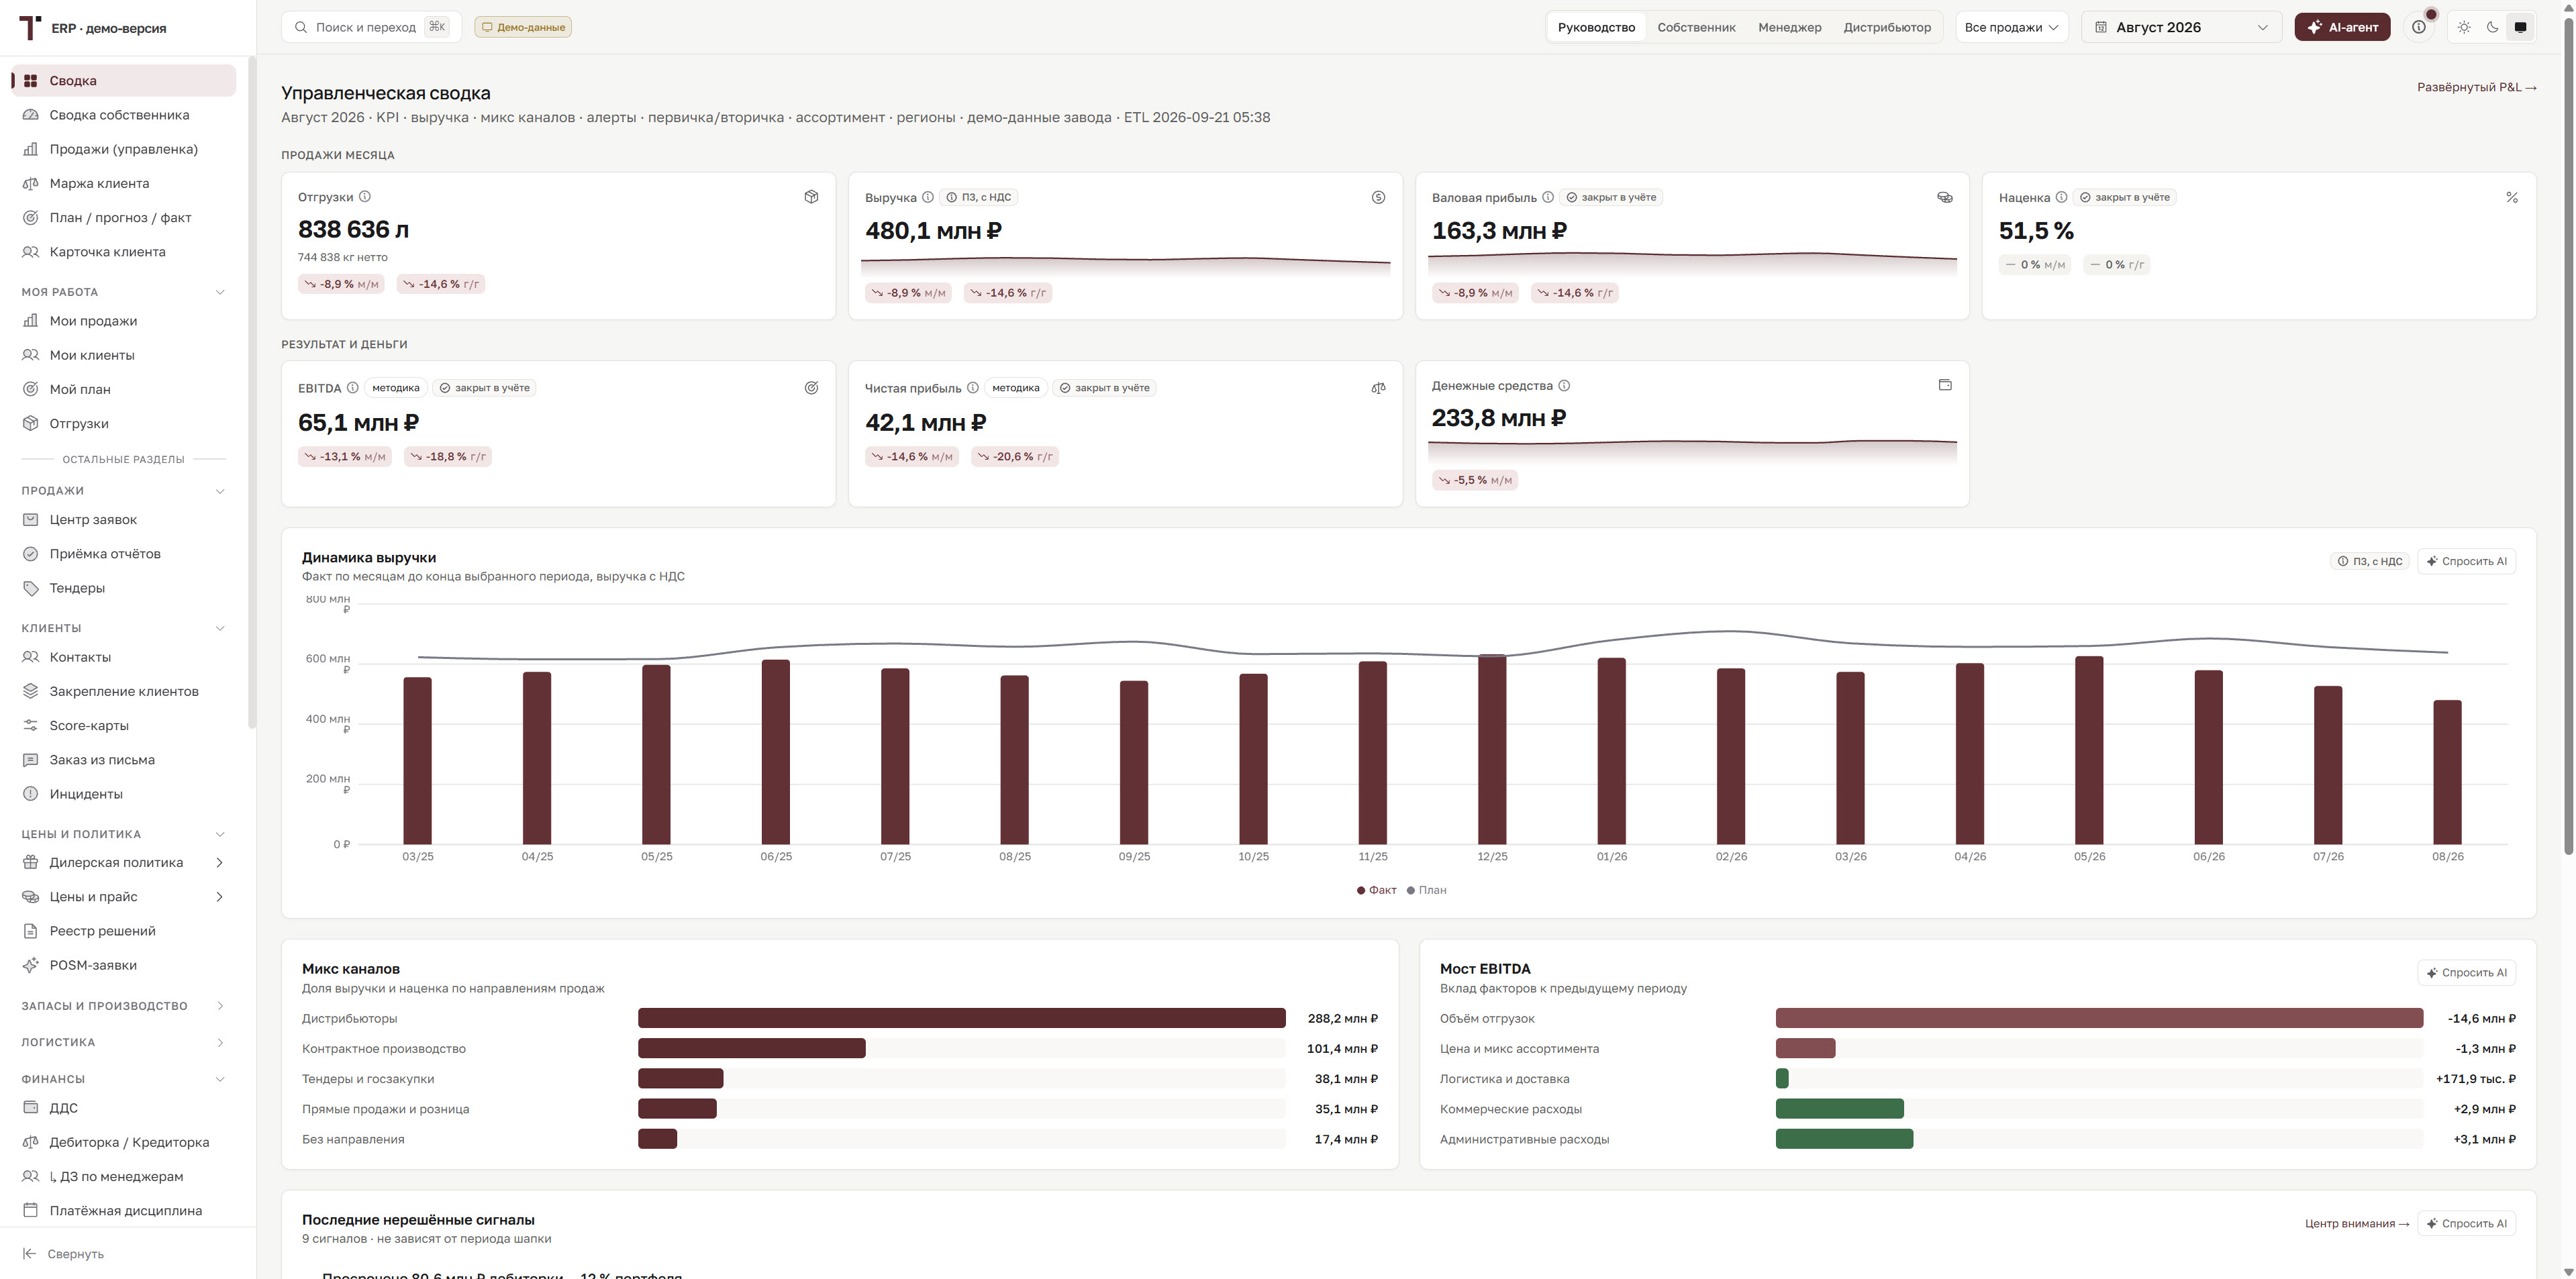
I had known the term ERP for a long time. In my mind, it stood for a big program that brings together sales, the warehouse, purchasing, production and finance. The company loads its data, the system puts everything in its place, and management gets neat tables and charts. The first meetings quickly changed that view. I realized that what management needs most to make good decisions is a complete and reliable picture of the company. In other words, an ERP system is built for sound management accounting.
Along the way, it turned out that every department — sales, production, procurement, management — speaks its own professional dialect, but almost every conversation comes back to money, the universal language of any business. The whole picture is built around financial metrics: revenue, cost of goods, profit, expenses, receivables and payables, inventory and cash flow. But beyond the values themselves, we need to understand where each number comes from. That takes a deep dive into the details of every business process. Behind the value of inventory are purchased raw materials, the work of production and finished goods in the warehouse. Behind revenue are a customer order, the right product in stock, a confirmed date and a completed shipment. Behind profit is a long chain of decisions made by different people at different times. An ERP system links these events together. It helps you see where a metric comes from, understand why it changed and decide what action can move the result. That was exactly the kind of system I was about to help build.
A project that started as a dashboard

At the end of June, our team got the initial brief: build a BI analytics system with AI features for a motor oil manufacturer. The client wanted management dashboards, tools for working with sales and inventory, workspaces for different roles and a digital assistant that could draw management’s attention to important deviations. We had the specification, so all that was left was to open the editor and start coding. In early July, the two sides signed the contract, and the team began preparing interviews with the plant’s staff. We put sales, customer service, production planning, procurement, accounting, finance and logistics under the microscope. And that’s when the word “dashboard” gradually began to give way to the word “system.” Showing a number is fairly easy. It’s much harder to understand where it came from, who owns it and what decision should follow when it changes. If an executive sees inventory growing, they need to see how that connects to sales and the production plan. If a sales manager spots overdue receivables, they need the list of customers and the next step. If an order is only partly covered, the system has to show which items are in stock, which are waiting to be produced and who is responsible for the deadline. Every new question, and every answer we got on our calls, added one more process to the product. At some point, looking over the list of everything we needed to build, I realized that dashboards alone wouldn’t do the job. We were building a full-fledged ERP system.
A plant that fit into a few tabs
On the first calls, all the processes looked compact. The commercial team sells the products. Production makes them. The warehouse stores them. Logistics delivers them. Finance counts the money. 1C runs between the departments, Excel spreadsheets live alongside it, and the executives want to see the big picture on one screen. Everything’s clear. We can all go home. That was exactly when our project manager joined the call and started asking questions: “How does a customer order reach the plant? Who checks product availability? At what point is the product reserved? Who promises the shipment date? What happens when there’s a shortage? How does an order get into the production plan? Who changes the priorities? Where is the lab test result recorded? When does a newly produced batch become available for sale?”
With every new answer, the diagram grew. We developers realized that the short phrase “ship the order” hides an entire, complex production cycle full of nuances, which I’ll cover in detail in the second article. As I listened carefully to the client, I was already picturing the future database. I diligently put the whole chain of reasoning and answers down on paper as diagrams, so that no process in the company would be overlooked. Vadim, our CTO, looked at my notes and asked: “So what counts as a fact here?” I was about to answer but decided to think a little longer. The question only seemed simple at first glance. “That’s something we still have to figure out,” I replied.

The five lives of a single stock figure
The first test was the word “stock.” It seemed straightforward, with no hidden depths. To an outsider, it’s the quantity of goods in the warehouse. Take the SKU, look up the number, put it on the screen: a simple algorithm. So I had already crossed this task off in my head. But at a plant, a single word like “stock” can have as many as five different meanings!
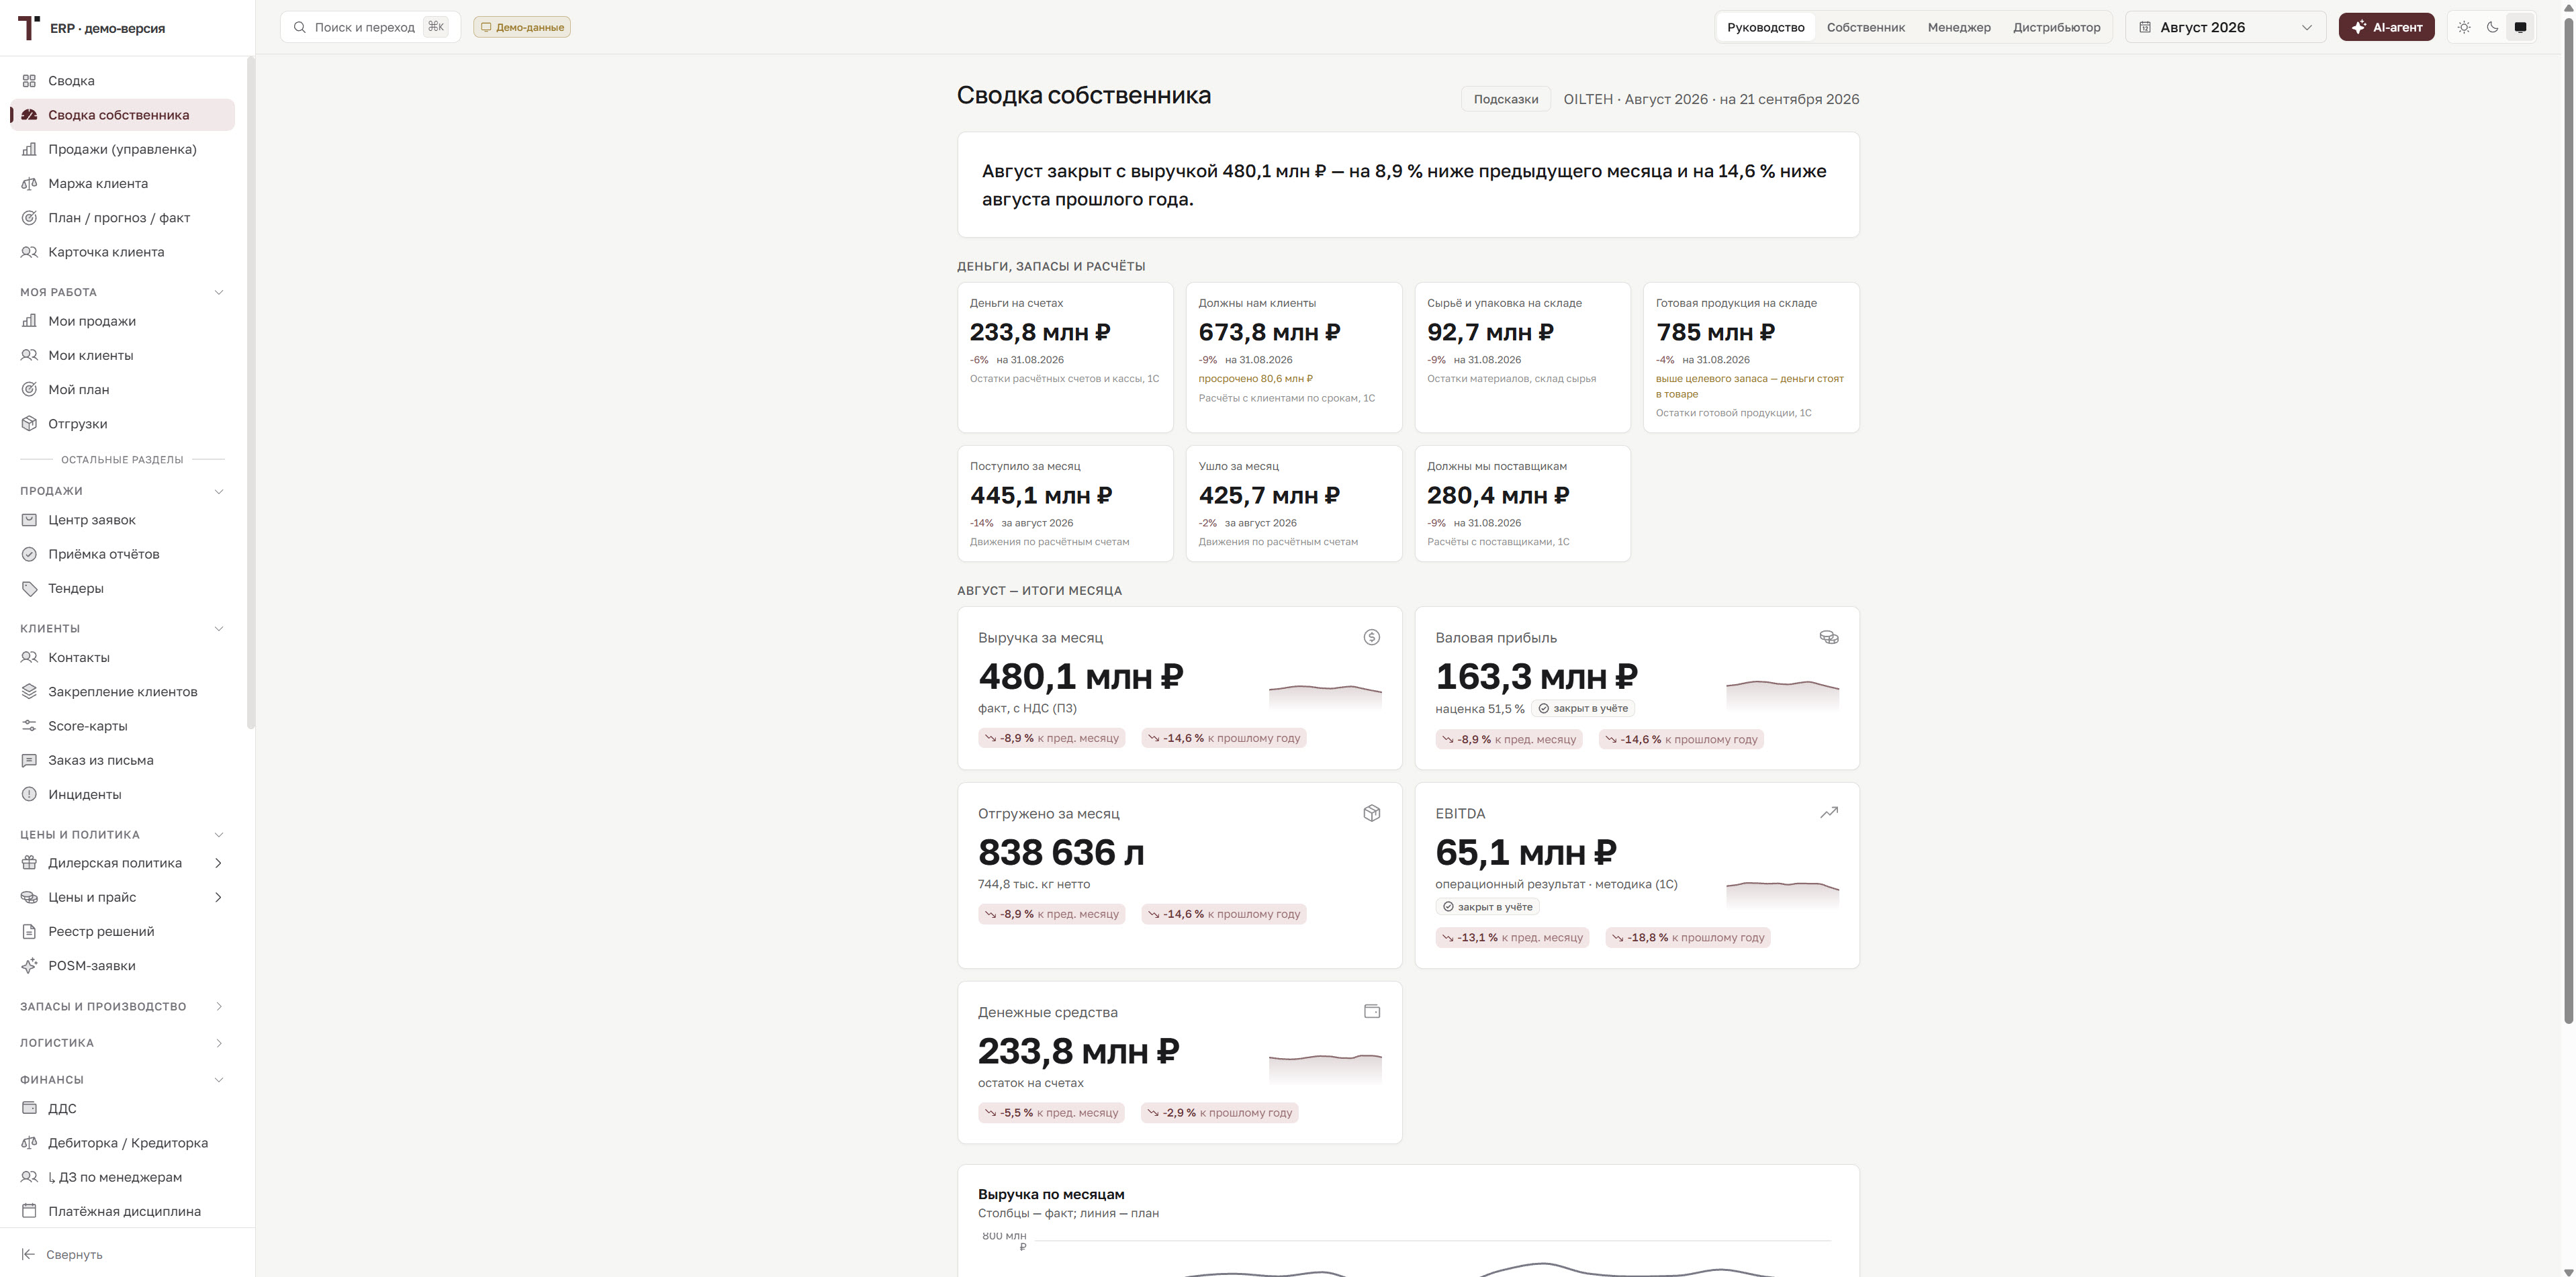
There’s physical stock: product that is actually on the warehouse premises. There’s the free quantity left after reservations. There’s a batch that has been produced but is still going through lab testing. There are goods held in custodial storage. And there are raw materials that will one day become finished products. A single metric turned into a decision-making model. I wrote in my notebook: “Stock is a number plus context.” But everyone is interested in stock for their own reasons. The commercial director asks how much product can be sold. Customer service wants to confirm an order. The planner is looking for a shortage that production needs to cover. The CFO sees money frozen in inventory. The owner is gauging the health of the business. So the definition had to change: “Stock is the answer to a specific person’s question.” One day, the owner spelled out what he expected from the system with perfect clarity. He wanted to see it all on one screen: the money in bank accounts, the money in receivables, the money in raw materials, the money in finished goods, incoming and outgoing payments, and payables. That’s the whole management philosophy. Where is the money? What state is it in? Where is it going? What is holding it up? Once he put it that way, ERP made much more sense to me. An executive needs a map of the money, and the system has to connect that map to what is happening at the plant.

When questions become part of development
In July, the team held a series of interviews with the plant’s staff. I expected to hear a list of features for the future system. Instead, people told us about their working day. One person began every morning with an export from 1C. Another pulled information together from several spreadsheets. A third checked order statuses by phone. Someone kept key standard rates in their head. Someone else manually matched different versions of the same customer’s name across sources. The company’s architecture turned out to be far broader than a set of applications. It included files, correspondence, verbal agreements and human experience, which together formed a fragile but surprisingly resilient structure. Our project manager taught us to always pay close attention to wording. If someone said “we usually do it like this,” we had to find out what happened to the exceptions. If we heard “it’s in 1C,” we had to open the specific report and study its fields. If two departments used the same word, we had to check that they meant the same thing. In the end, the interviews felt more like an investigation. Every metric got its own biography: who creates it, where it is stored, who corrects errors in it, who trusts it and what action comes next.
I began to understand why an experienced analyst can spend half an hour discussing a single field in a table. The old me would have used that half hour to create the field, put it on the screen and even pick an icon for it. Now, behind every field stood a customer order, a production batch or an amount that shapes an executive’s decision. This was no place to rush.

My first crisis of scale
Around this time, a doubt crept in: “Do I have enough experience for this?” Before the project, I had written code, worked with databases and built interfaces. Here, every technical decision came with an industrial context. A mistake in a university project could at worst earn me a failing grade. A mistake in a live production system can distort the inventory picture, shift production priorities or create a false sense that an order is covered. So the responsibility felt almost physical. I looked at the diagram of the future system, where sales connected to the warehouse, the warehouse to production, production to procurement, and all of it to finance. It looked like the subway map of a city I was visiting for the first time. Except that some stations were still under construction, a few lines existed only in Excel, and the train schedule was kept in the head of one experienced employee. I wanted to prove my worth quickly: write a module, build a screen, show a result. Speed gave me a familiar sense of progress. Vadim offered a different reference point: “First get confident in one metric, and only then add the next one.” That phrase became my anchor. A big, complex problem can never be solved with a complex, cumbersome solution. But it can be solved with a chain of small, verifiable ones. The scale stayed the same. What changed was the way I looked at it.

The prototype as a way to ask questions
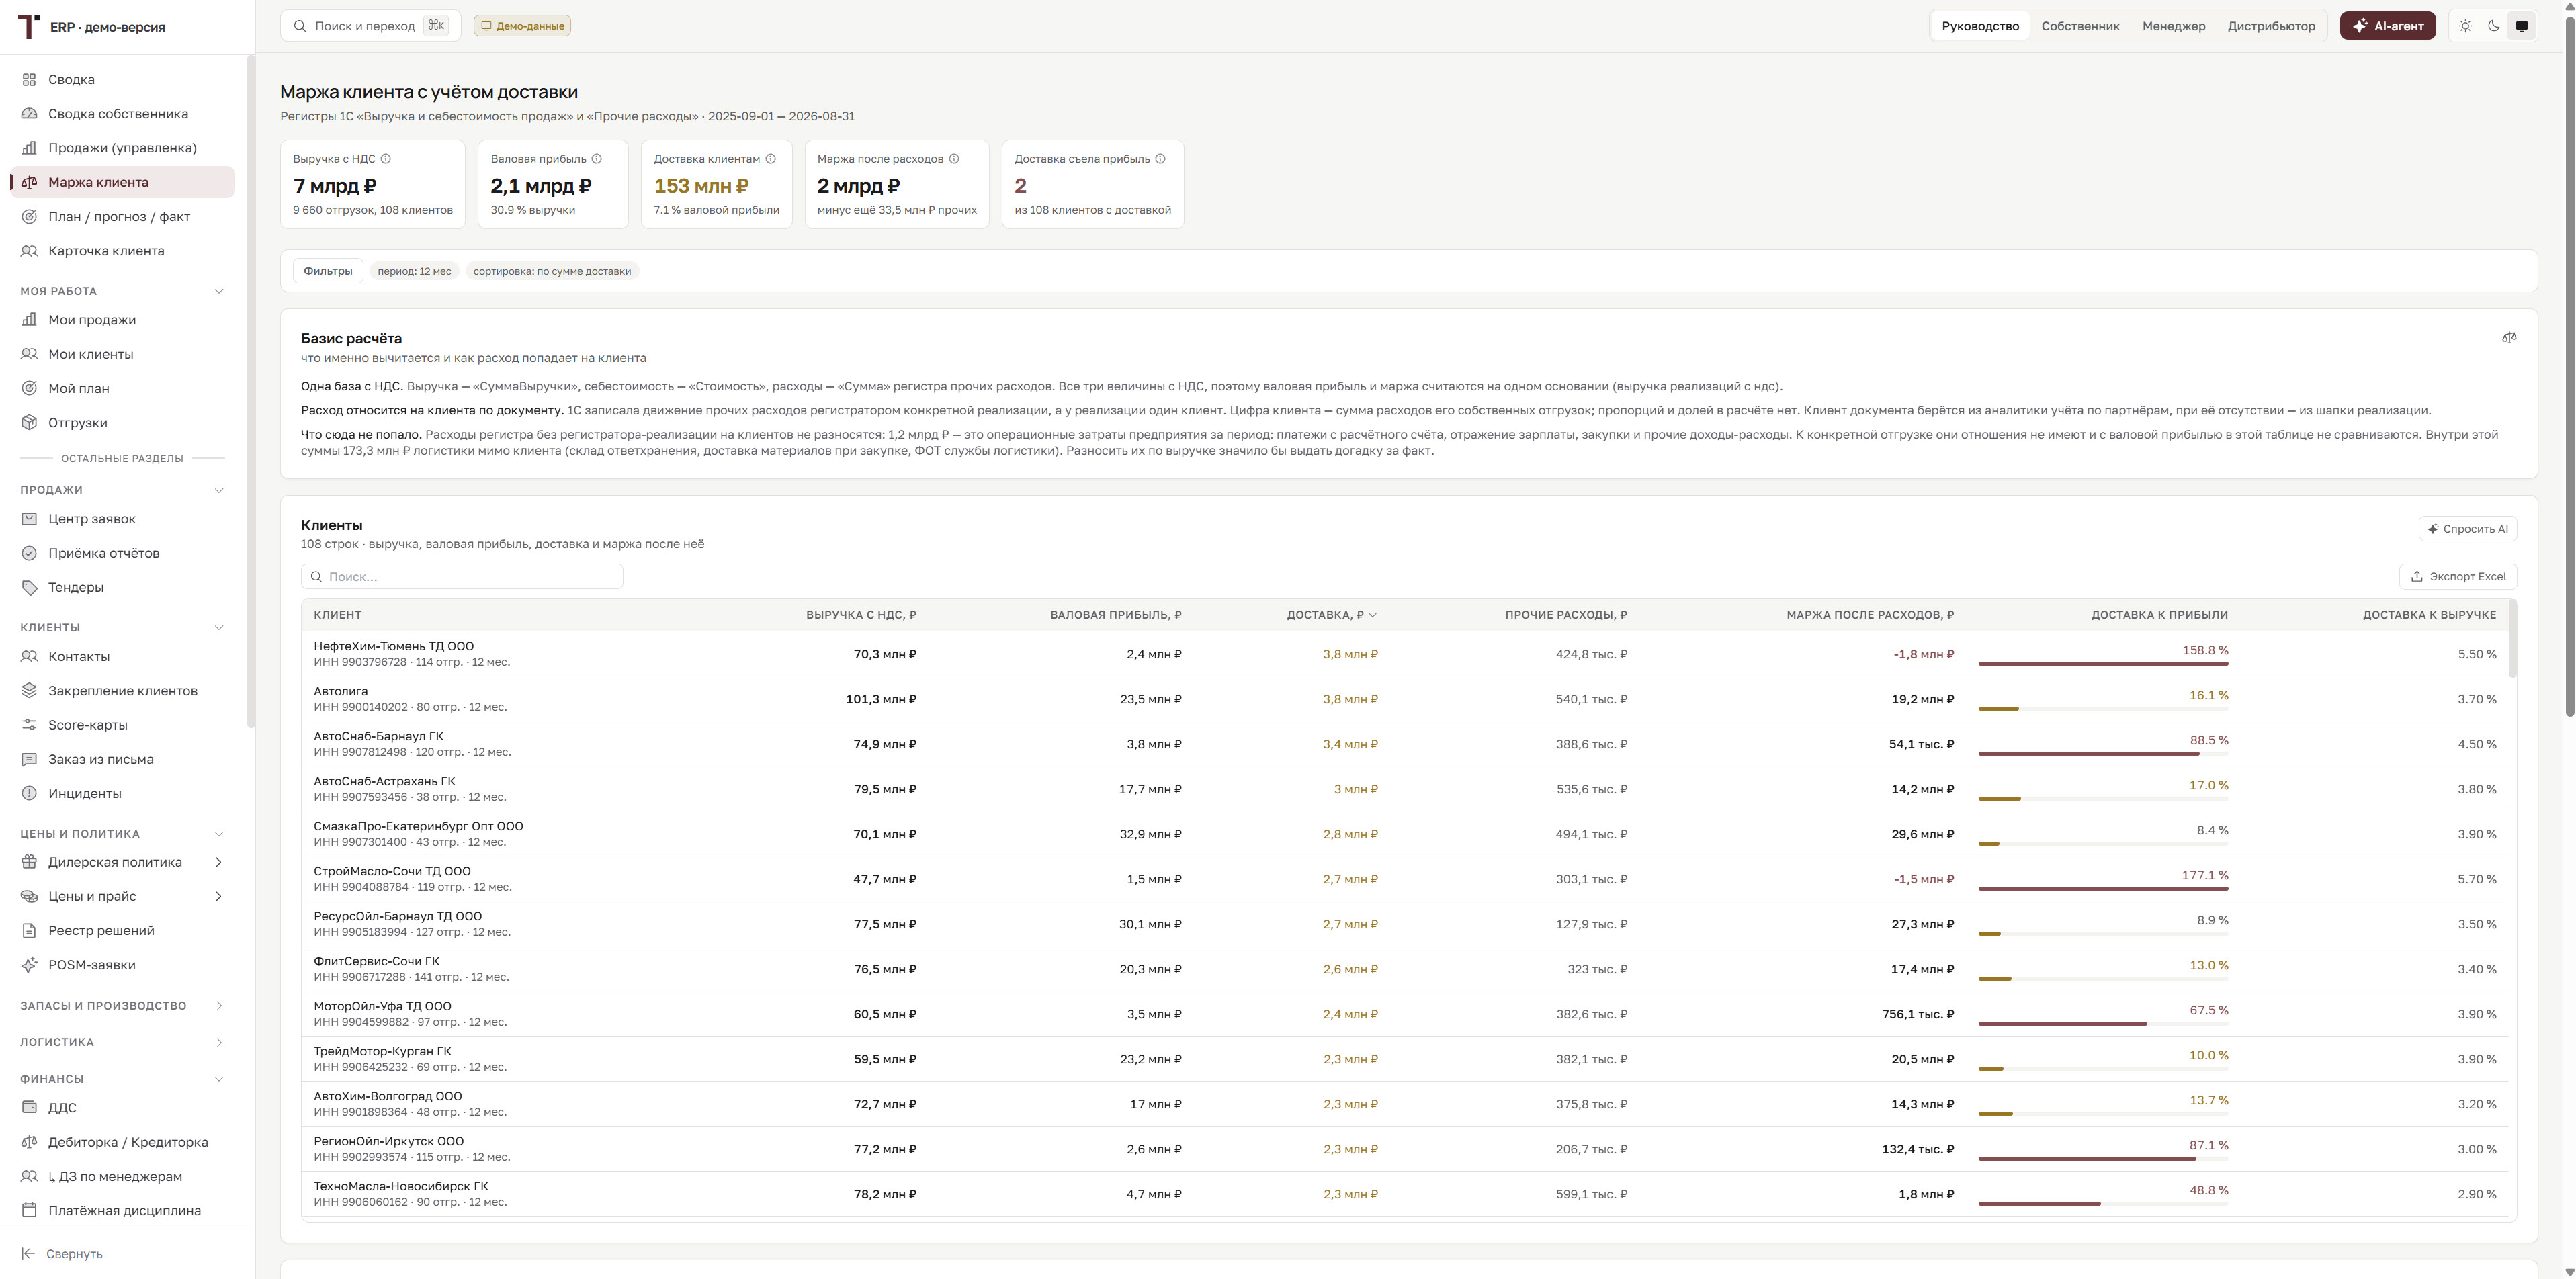
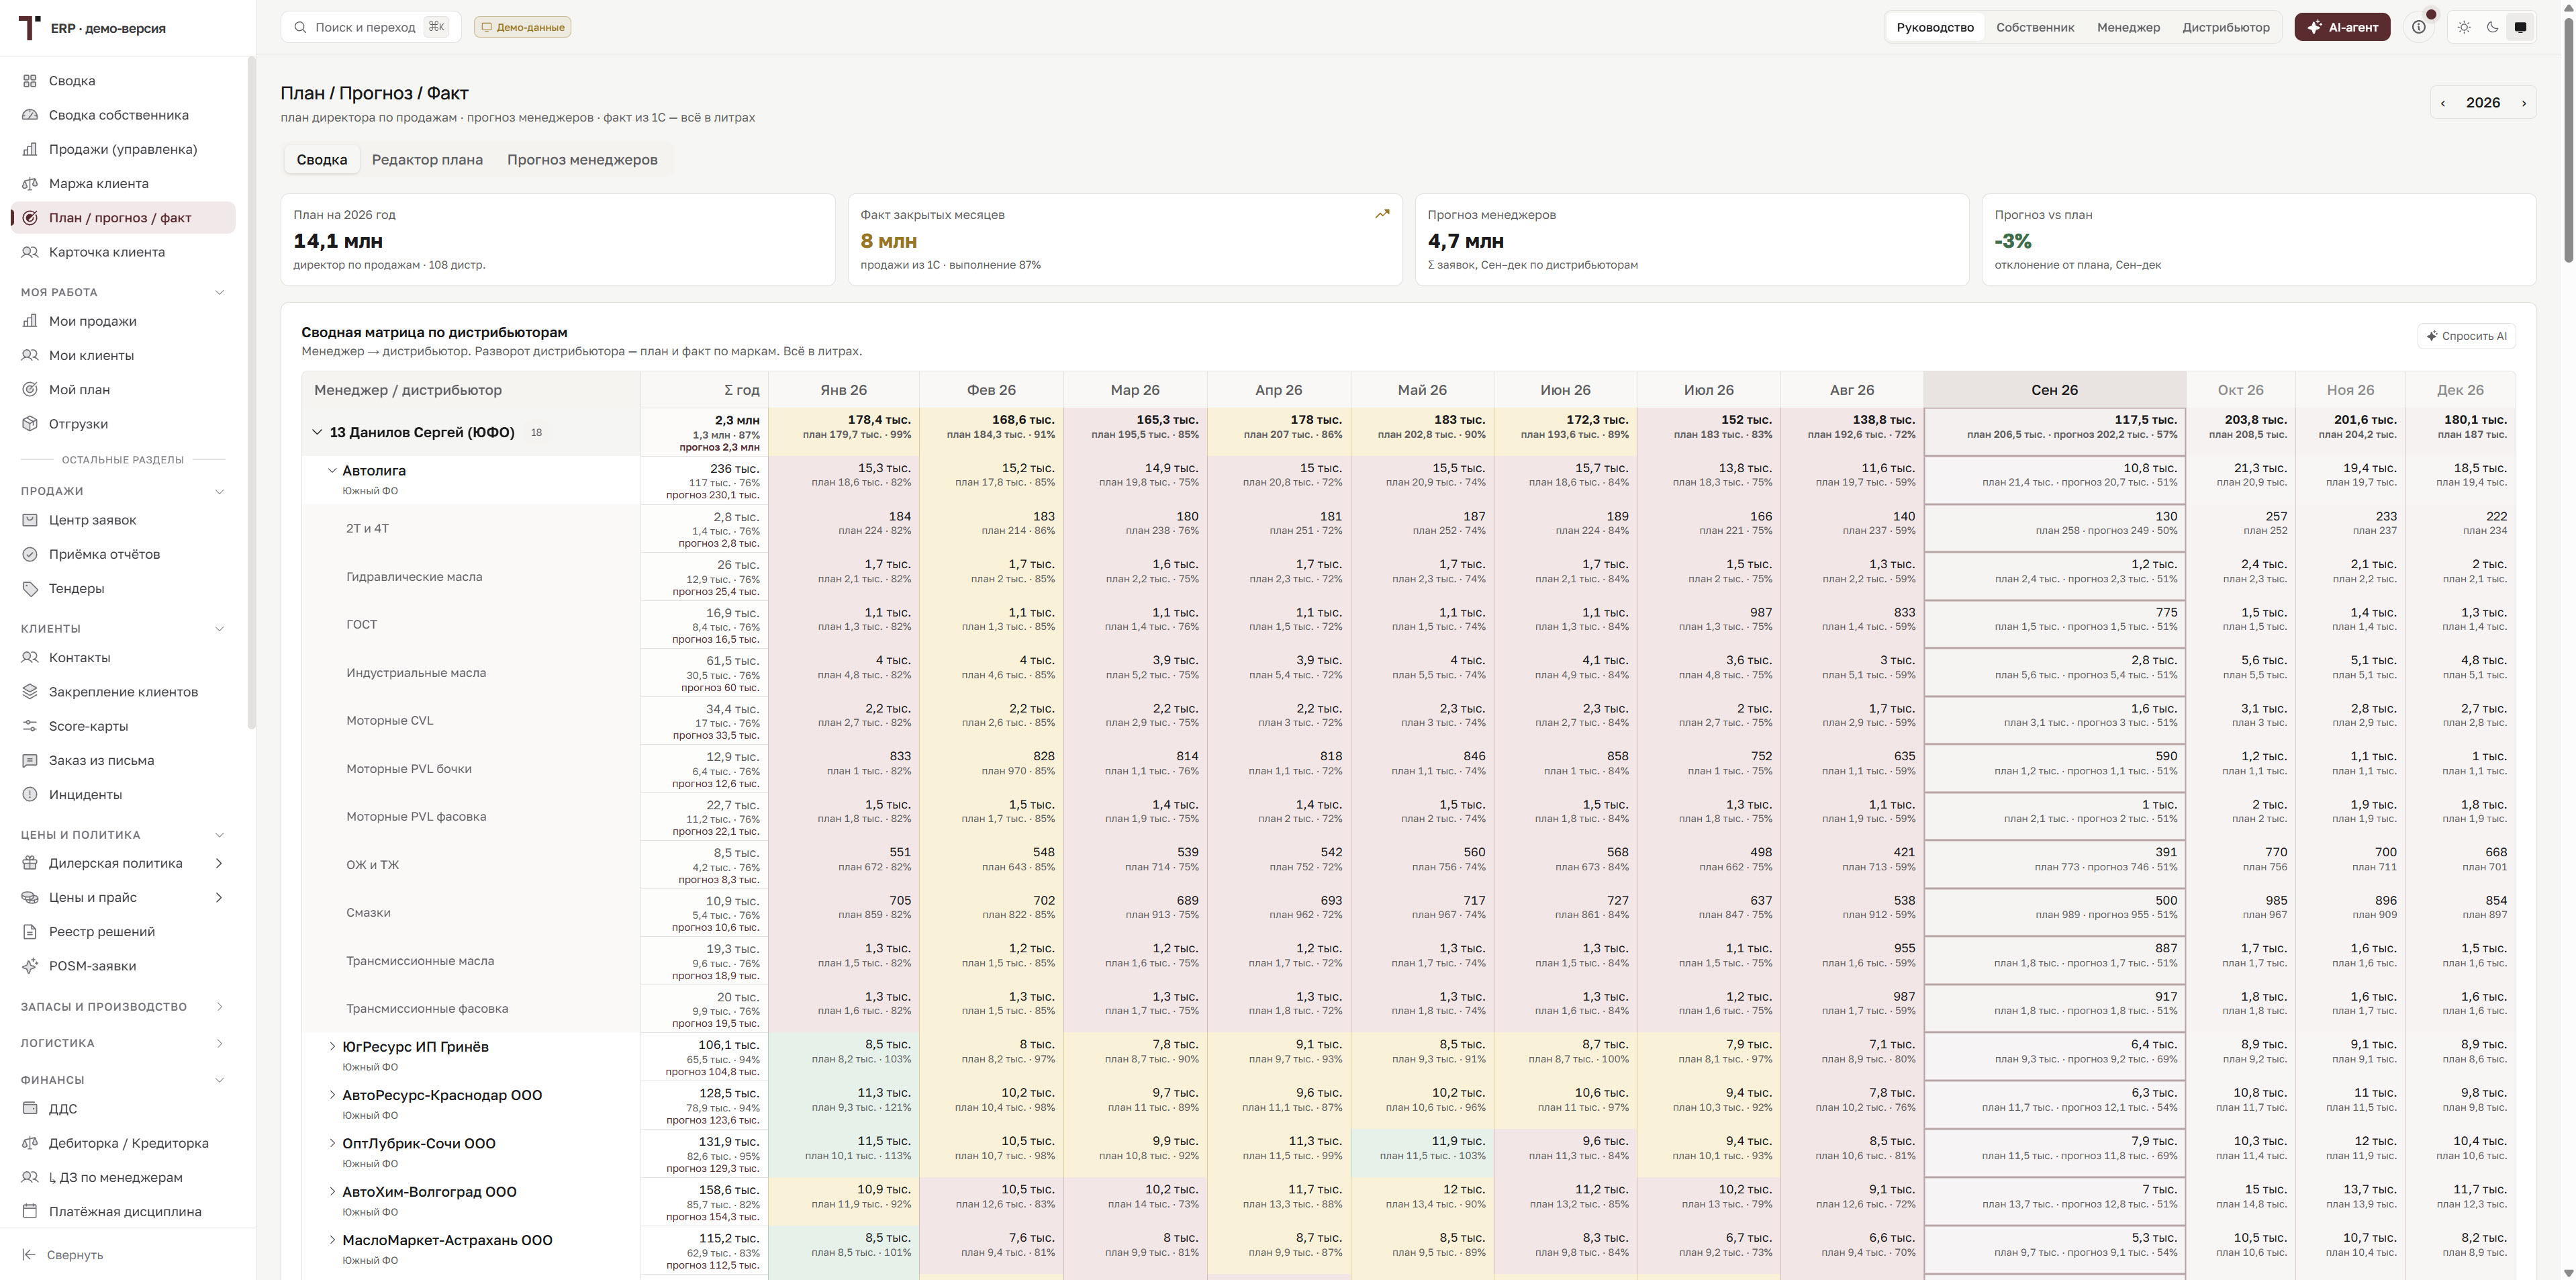
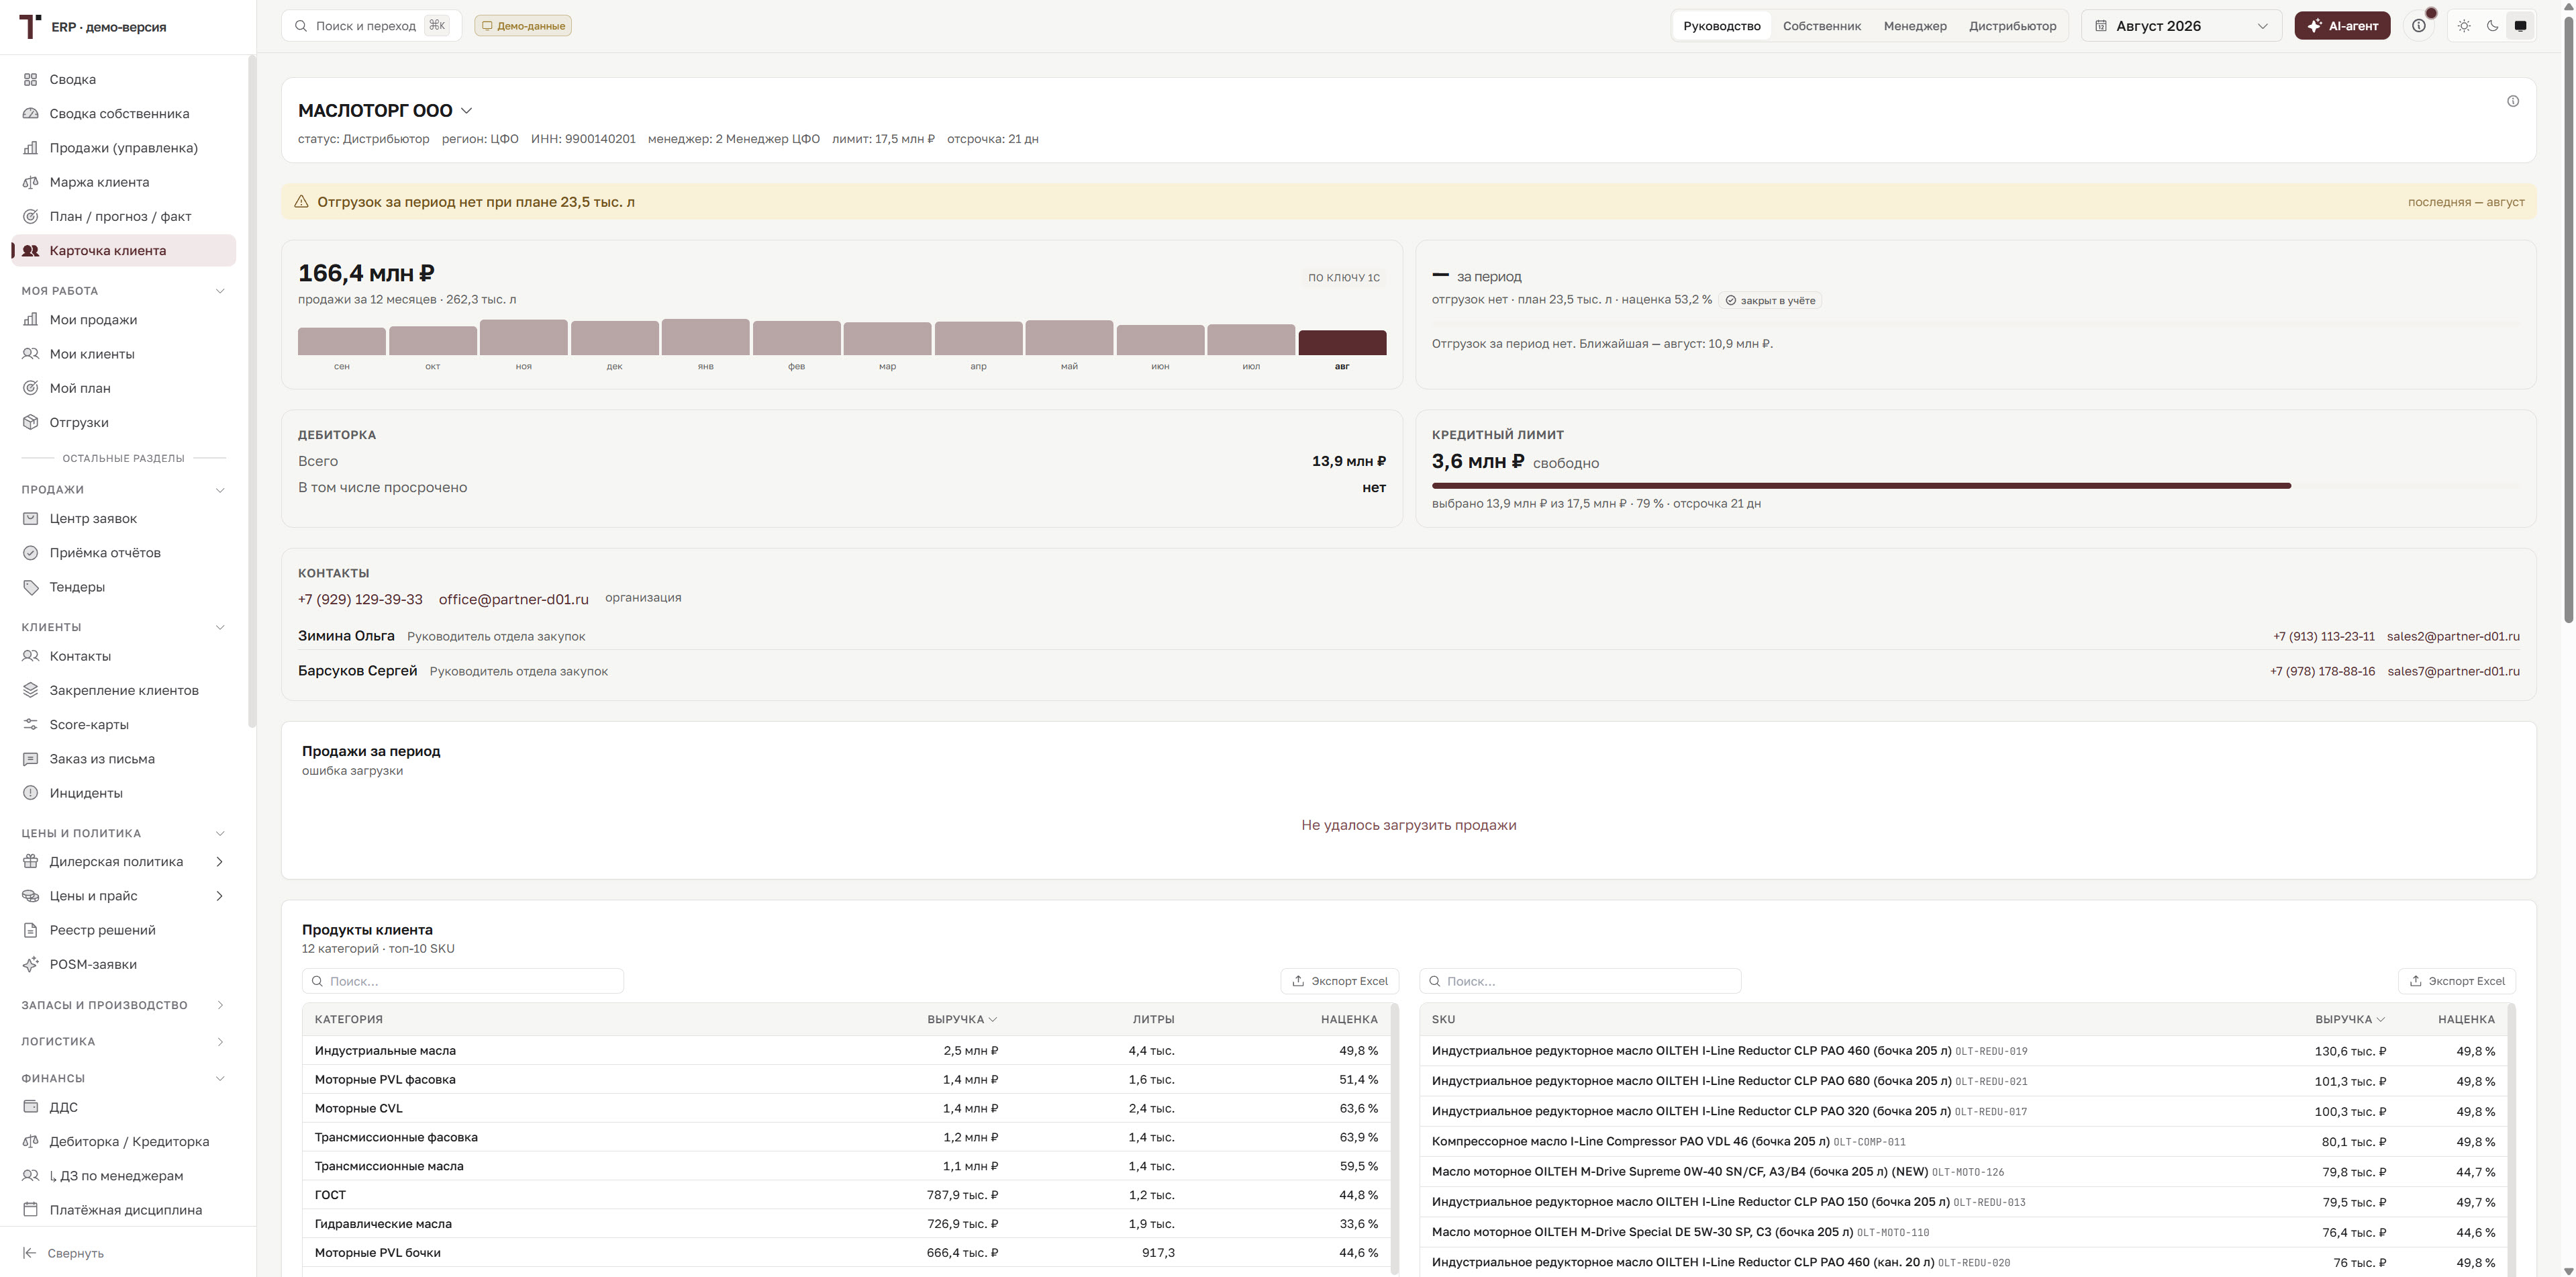
In early August, we showed the working group the interface of the future system. I thought of the prototype as an early version of the product. Our project manager called it a tool for conversation. The difference between these two views became clear at the very first demo. As soon as someone saw a familiar metric on the screen, they asked a precise question: where did this amount come from, are returns included, which warehouse is selected, where did the sales of a particular business line end up, what does the row color mean. Later, real data from 1C came into the system, and the conversation became even more concrete. Users checked revenue, volumes, profit, filters, sales managers and plans. Feedback arrived almost daily. Sometimes it was short: “The numbers don’t match.” Sometimes it came with a report, a screenshot and an explanation attached. We quickly tracked down the cause, refined the methodology, recalculated the metric and showed the result again. That’s how development went: show, get feedback, find the rule, fix, reconcile.

The interface worked like a mirror. It reflected our understanding of the plant, and the staff helped us find the distortions. Sometimes a screen got simpler after a meeting. Sometimes a new filter appeared. Sometimes the data model changed. At first, this hurt my pride as a developer. After all, the code is written, the screen looks good, the button is perfectly aligned. You want to hear: “Great, let’s keep it.” Instead, someone asks about the calculation method, and the button suddenly becomes the most stable part of the whole solution. A change after a conversation meant the system had moved closer to reality. The code turned the team’s knowledge into a tool for everyday work. A beautiful chart impresses people for a few minutes. Being able to explain where every number comes from builds trust for years.
Two professional lenses
On this project, I gained two professional lenses through which I could “calibrate” my own perception. Vadim looks at the system in terms of architecture, data quality, resilience and security. He wants to know where a value comes from, how often it is updated, how an integration behaves when something fails and whether a calculation can be reproduced. Our project manager looks at it through people and management decisions: who will open a screen, what question will bring someone into the system, what action will follow from what they see and who is responsible for the result. At first, these views seemed like separate lines of work. Then they came together. Solid architecture with no clear user action turns into a technical monument to itself. A convenient screen without verifiable data becomes a convincing illusion. A real industrial product emerges where the two disciplines meet. My own role began to change, too. I asked more and more often where data came from and was in less of a hurry to propose a ready-made interface element. Instead of the single question “How do I build this?” I now had several new ones: “Who makes the decision? What information do they need? Who owns that information? How can we check that it’s reliable? What happens after someone clicks the button?” It seems this is how a programmer starts turning into a product developer.

Where we are now
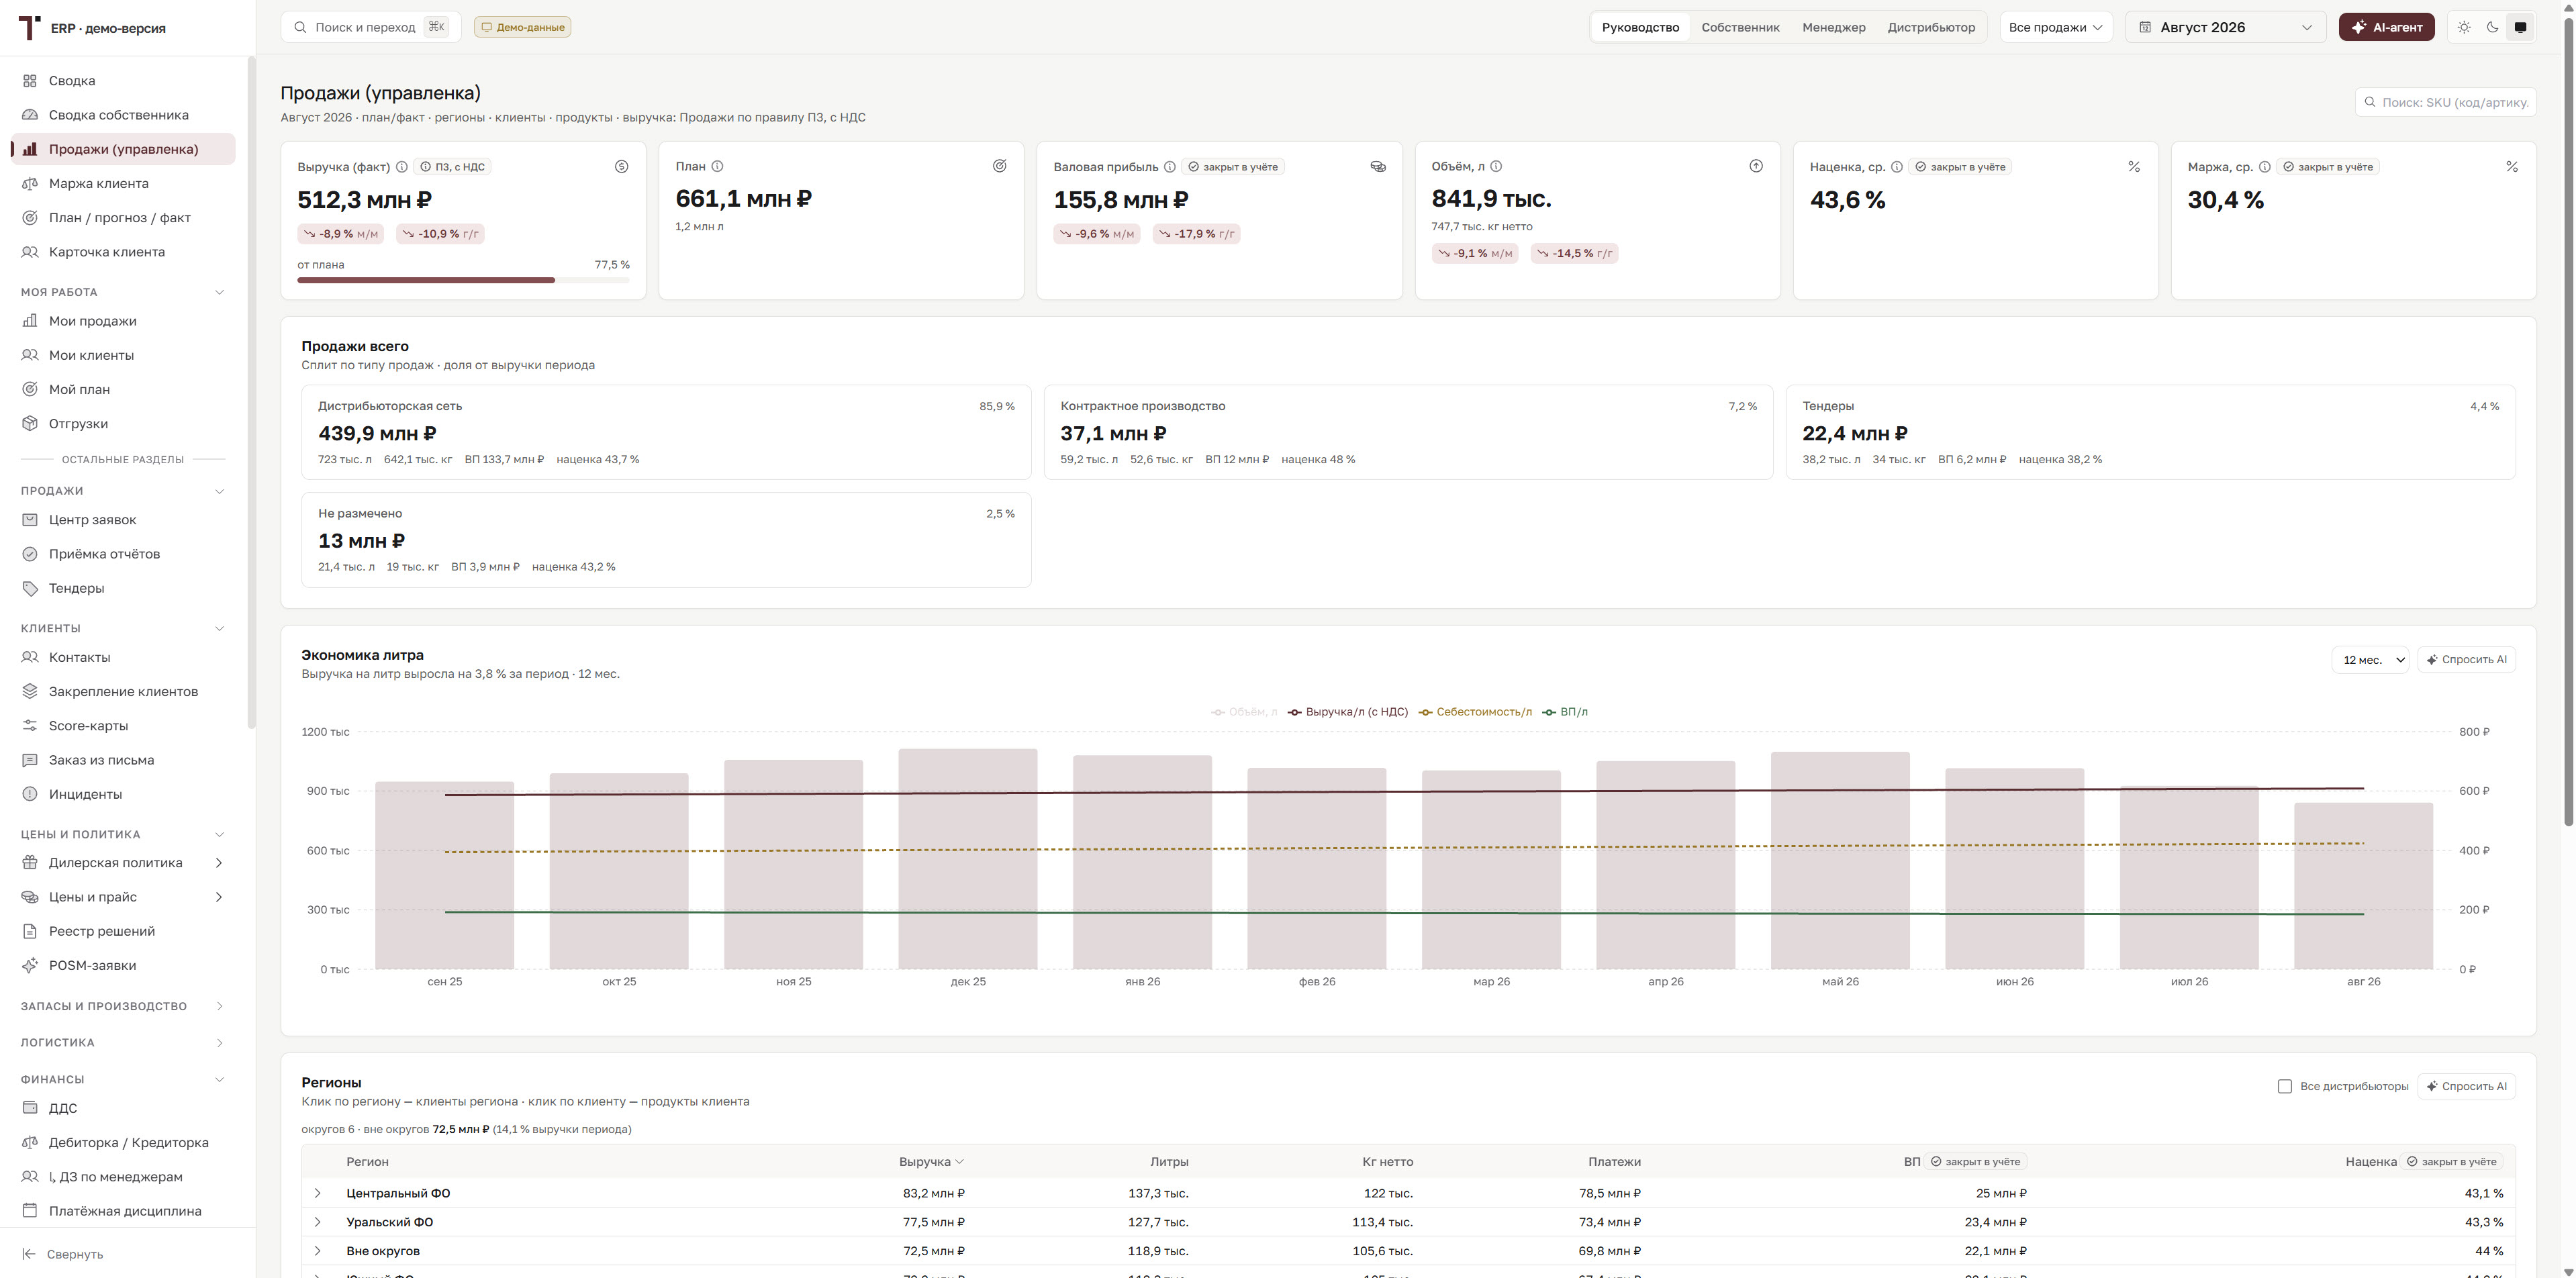
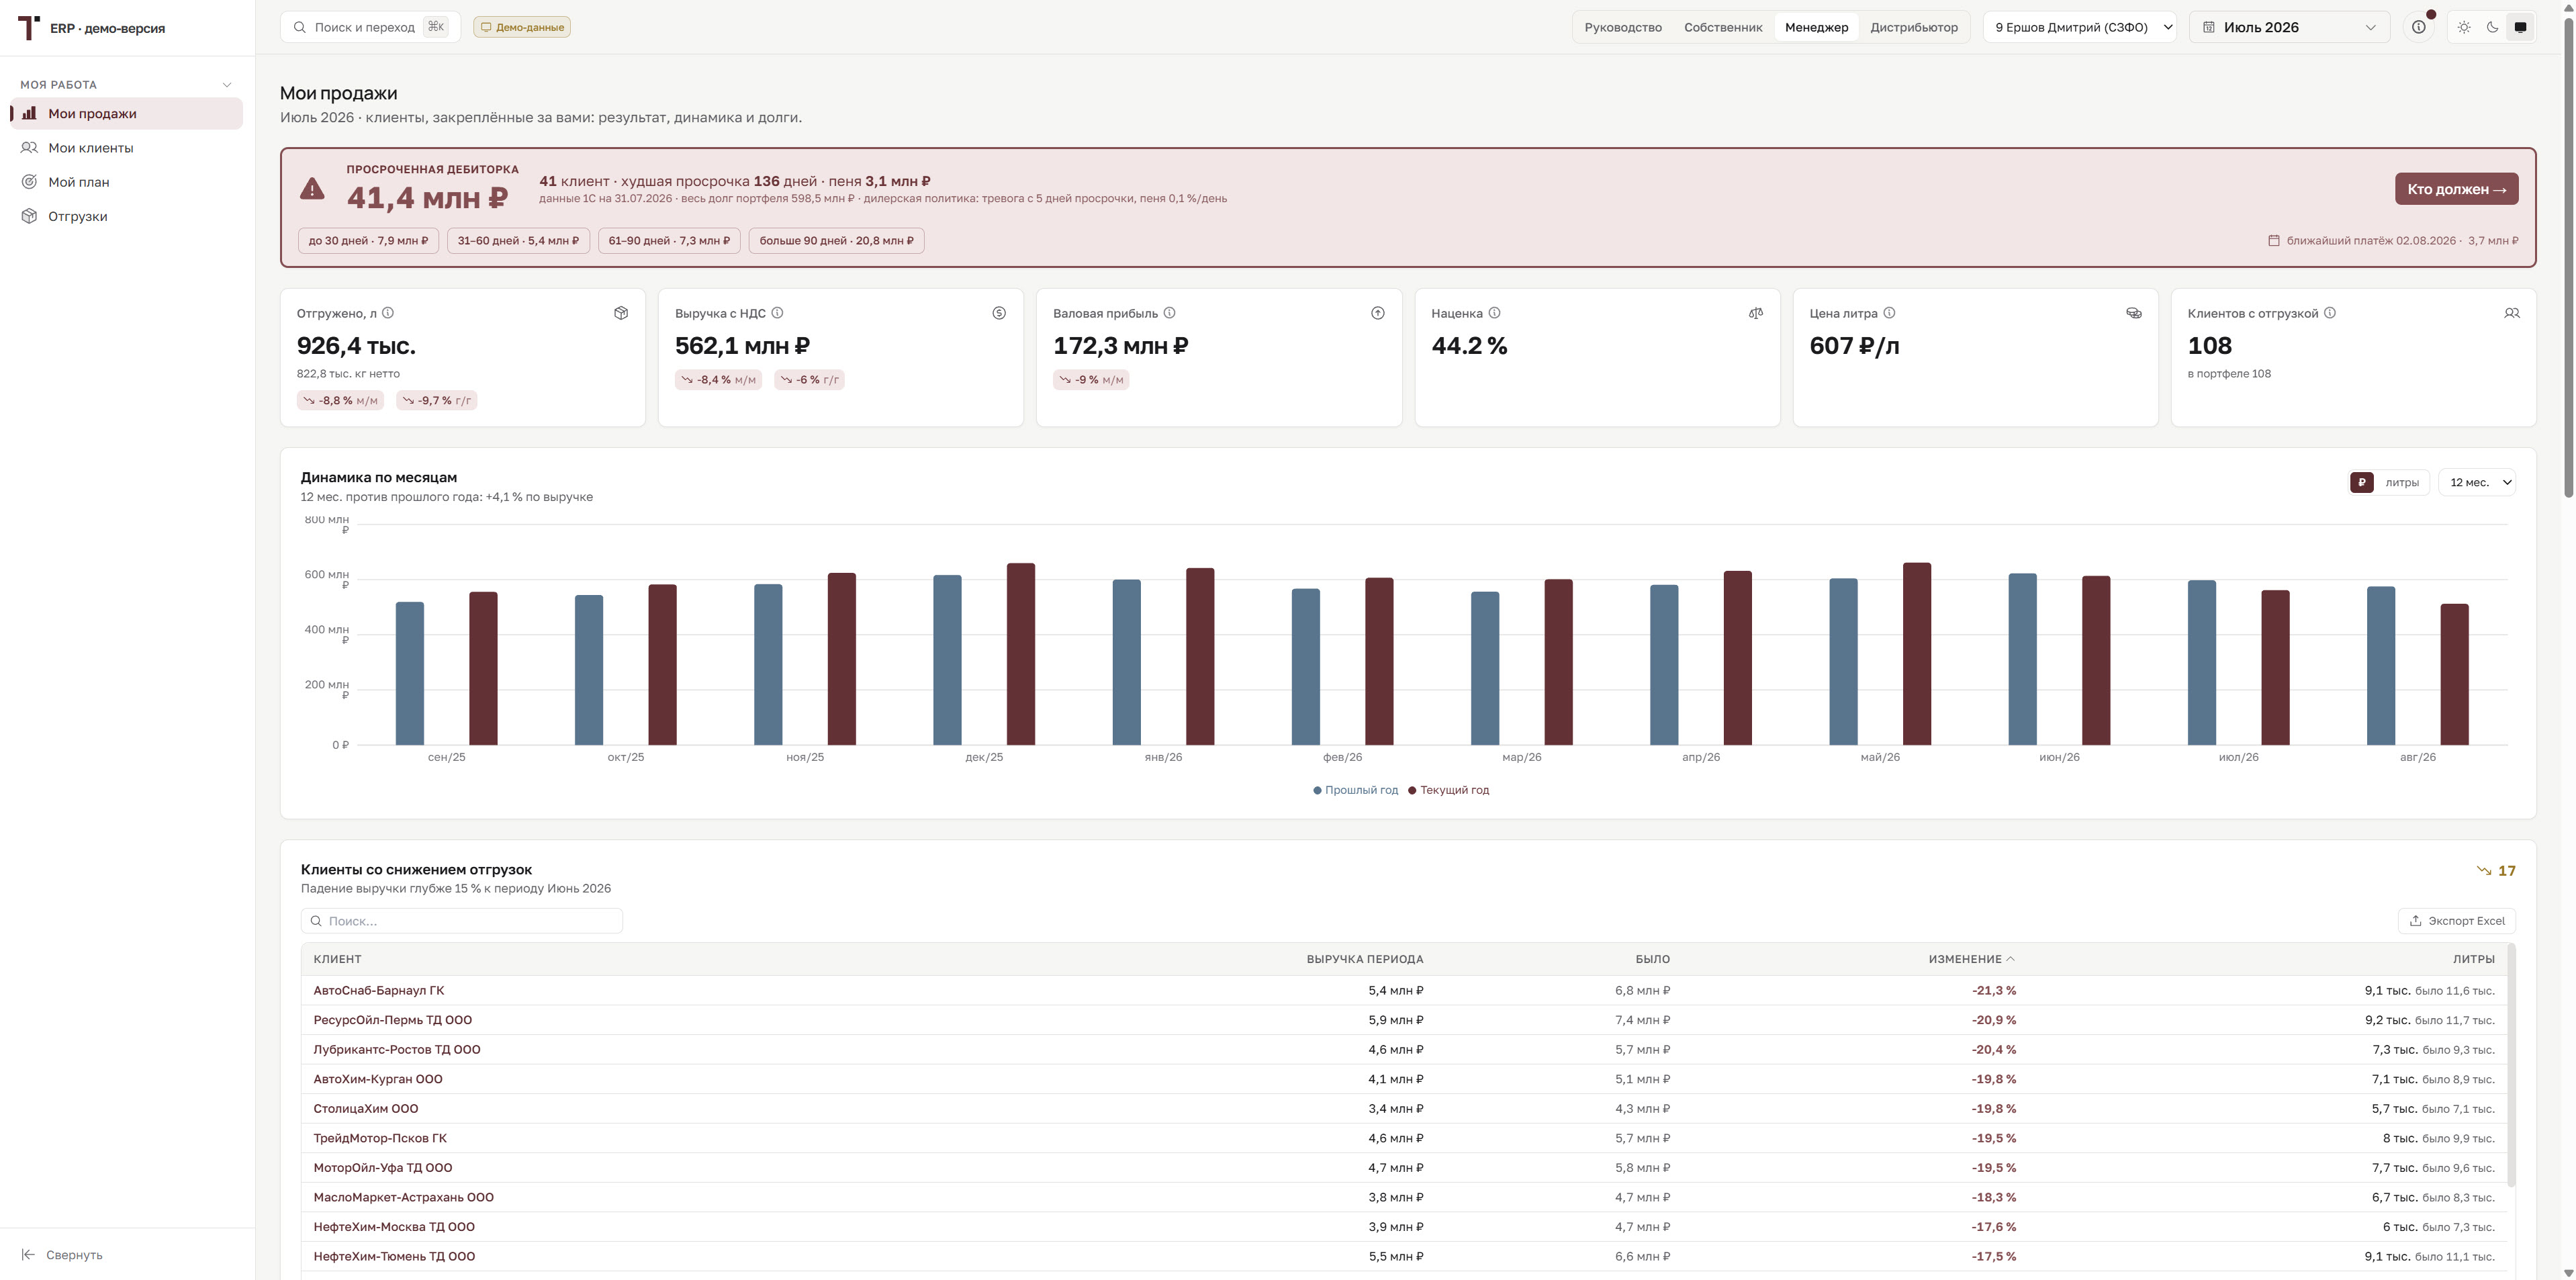
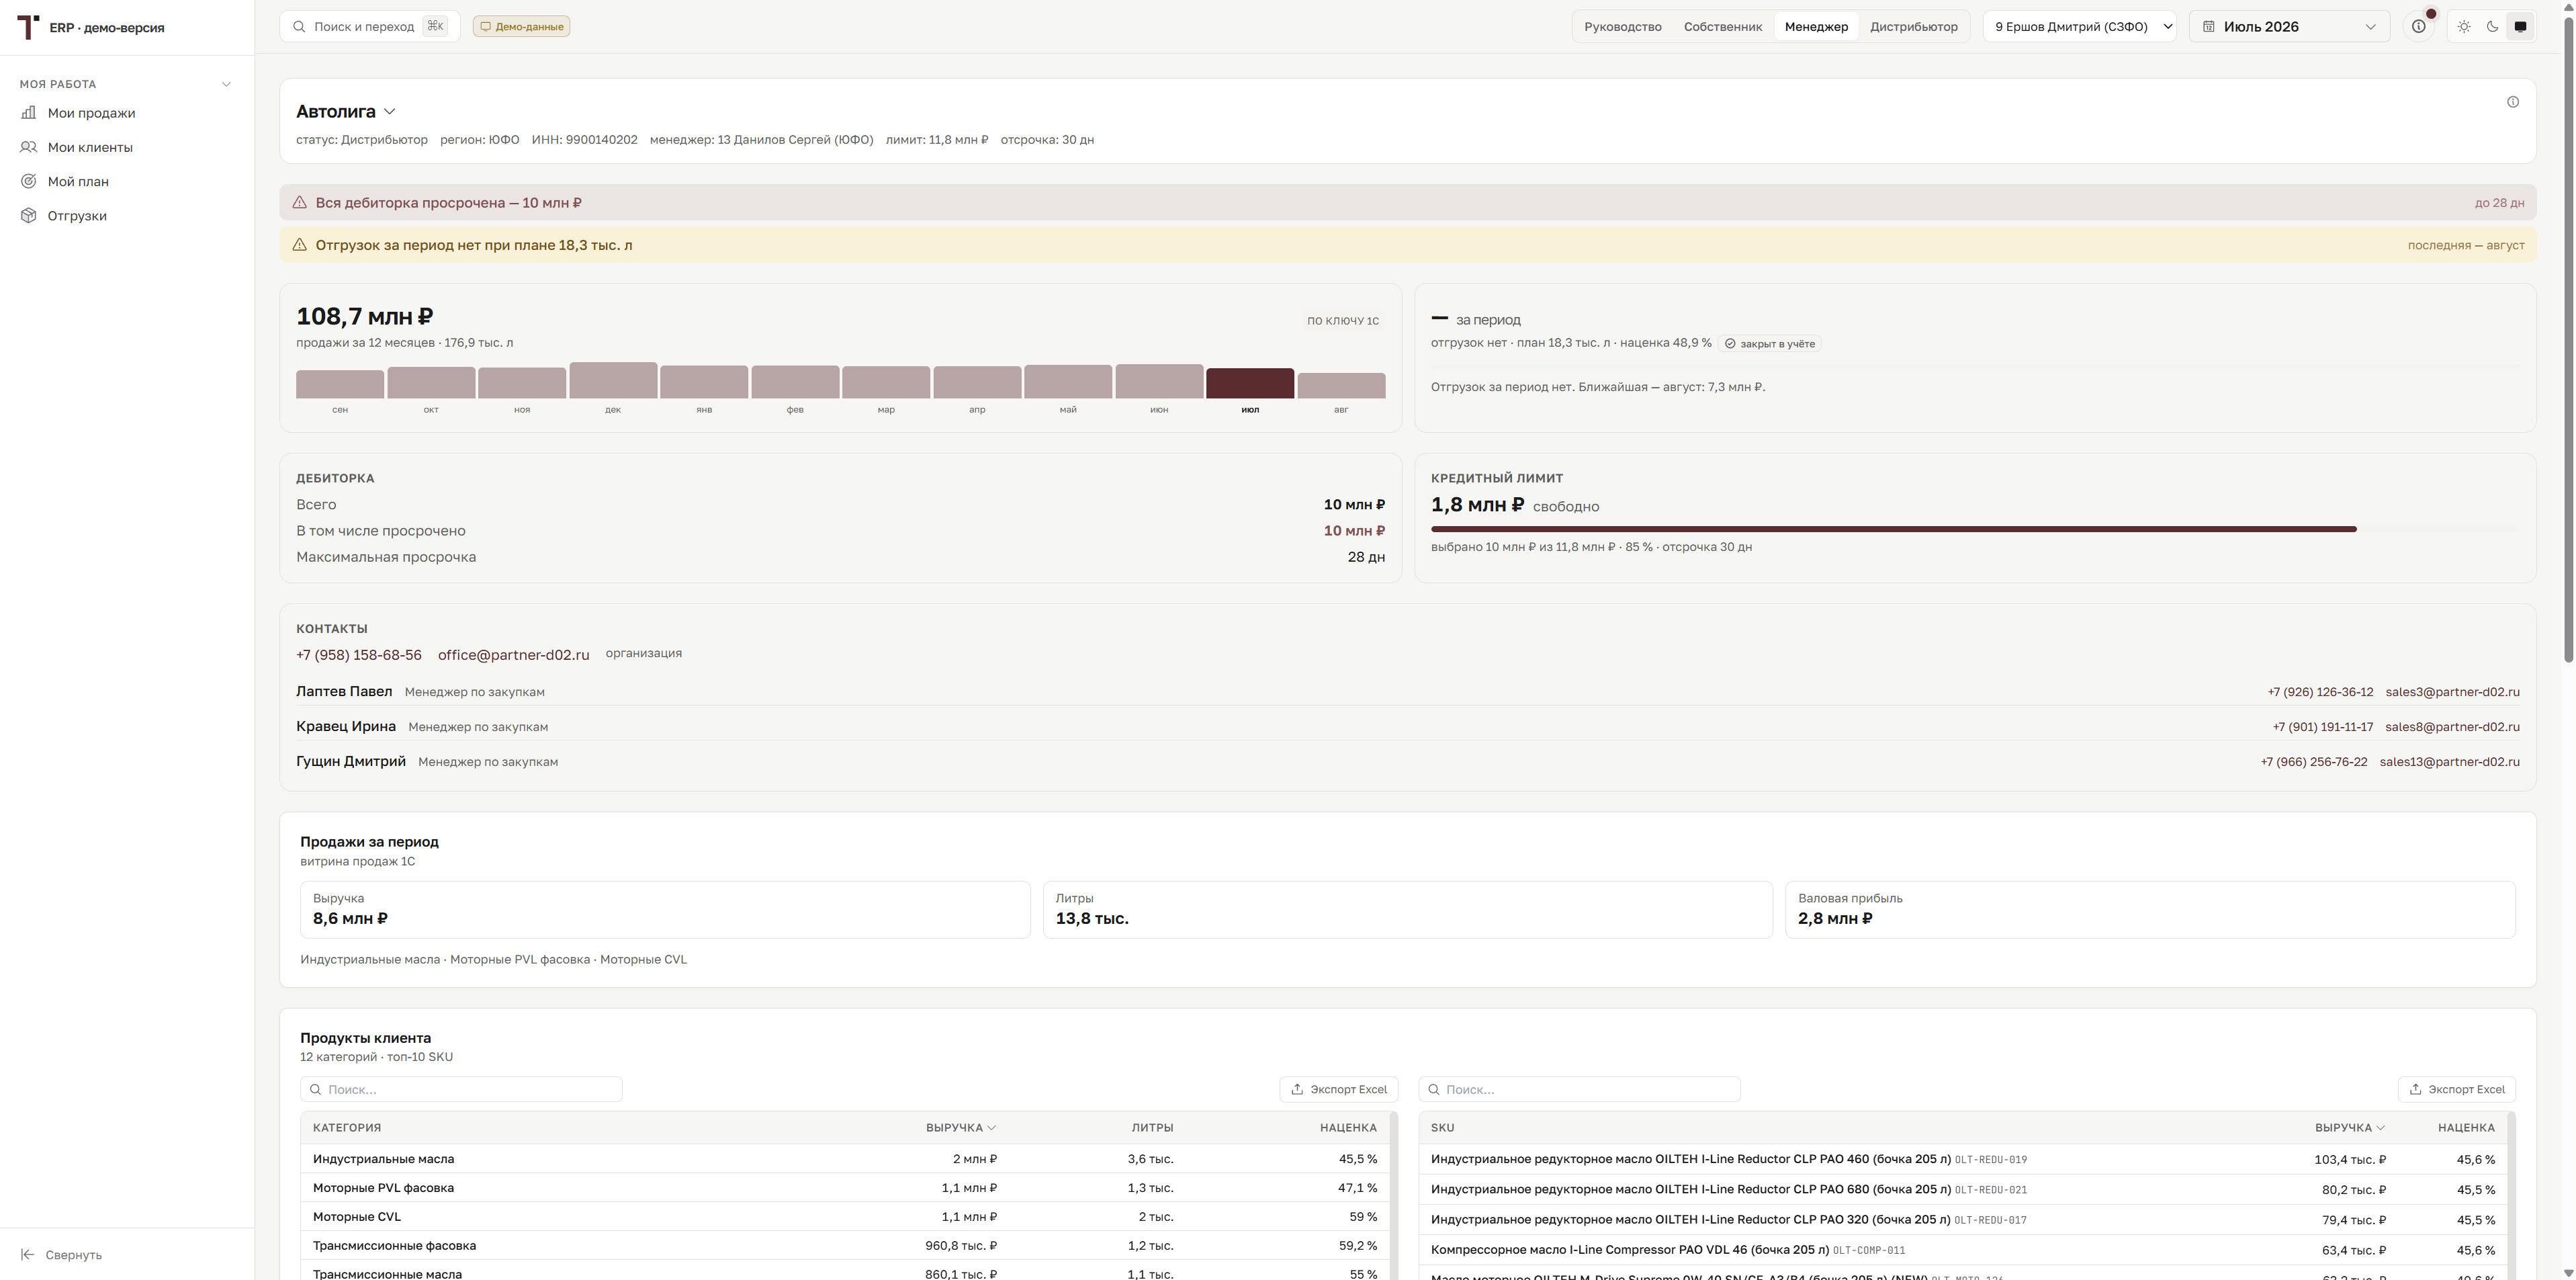
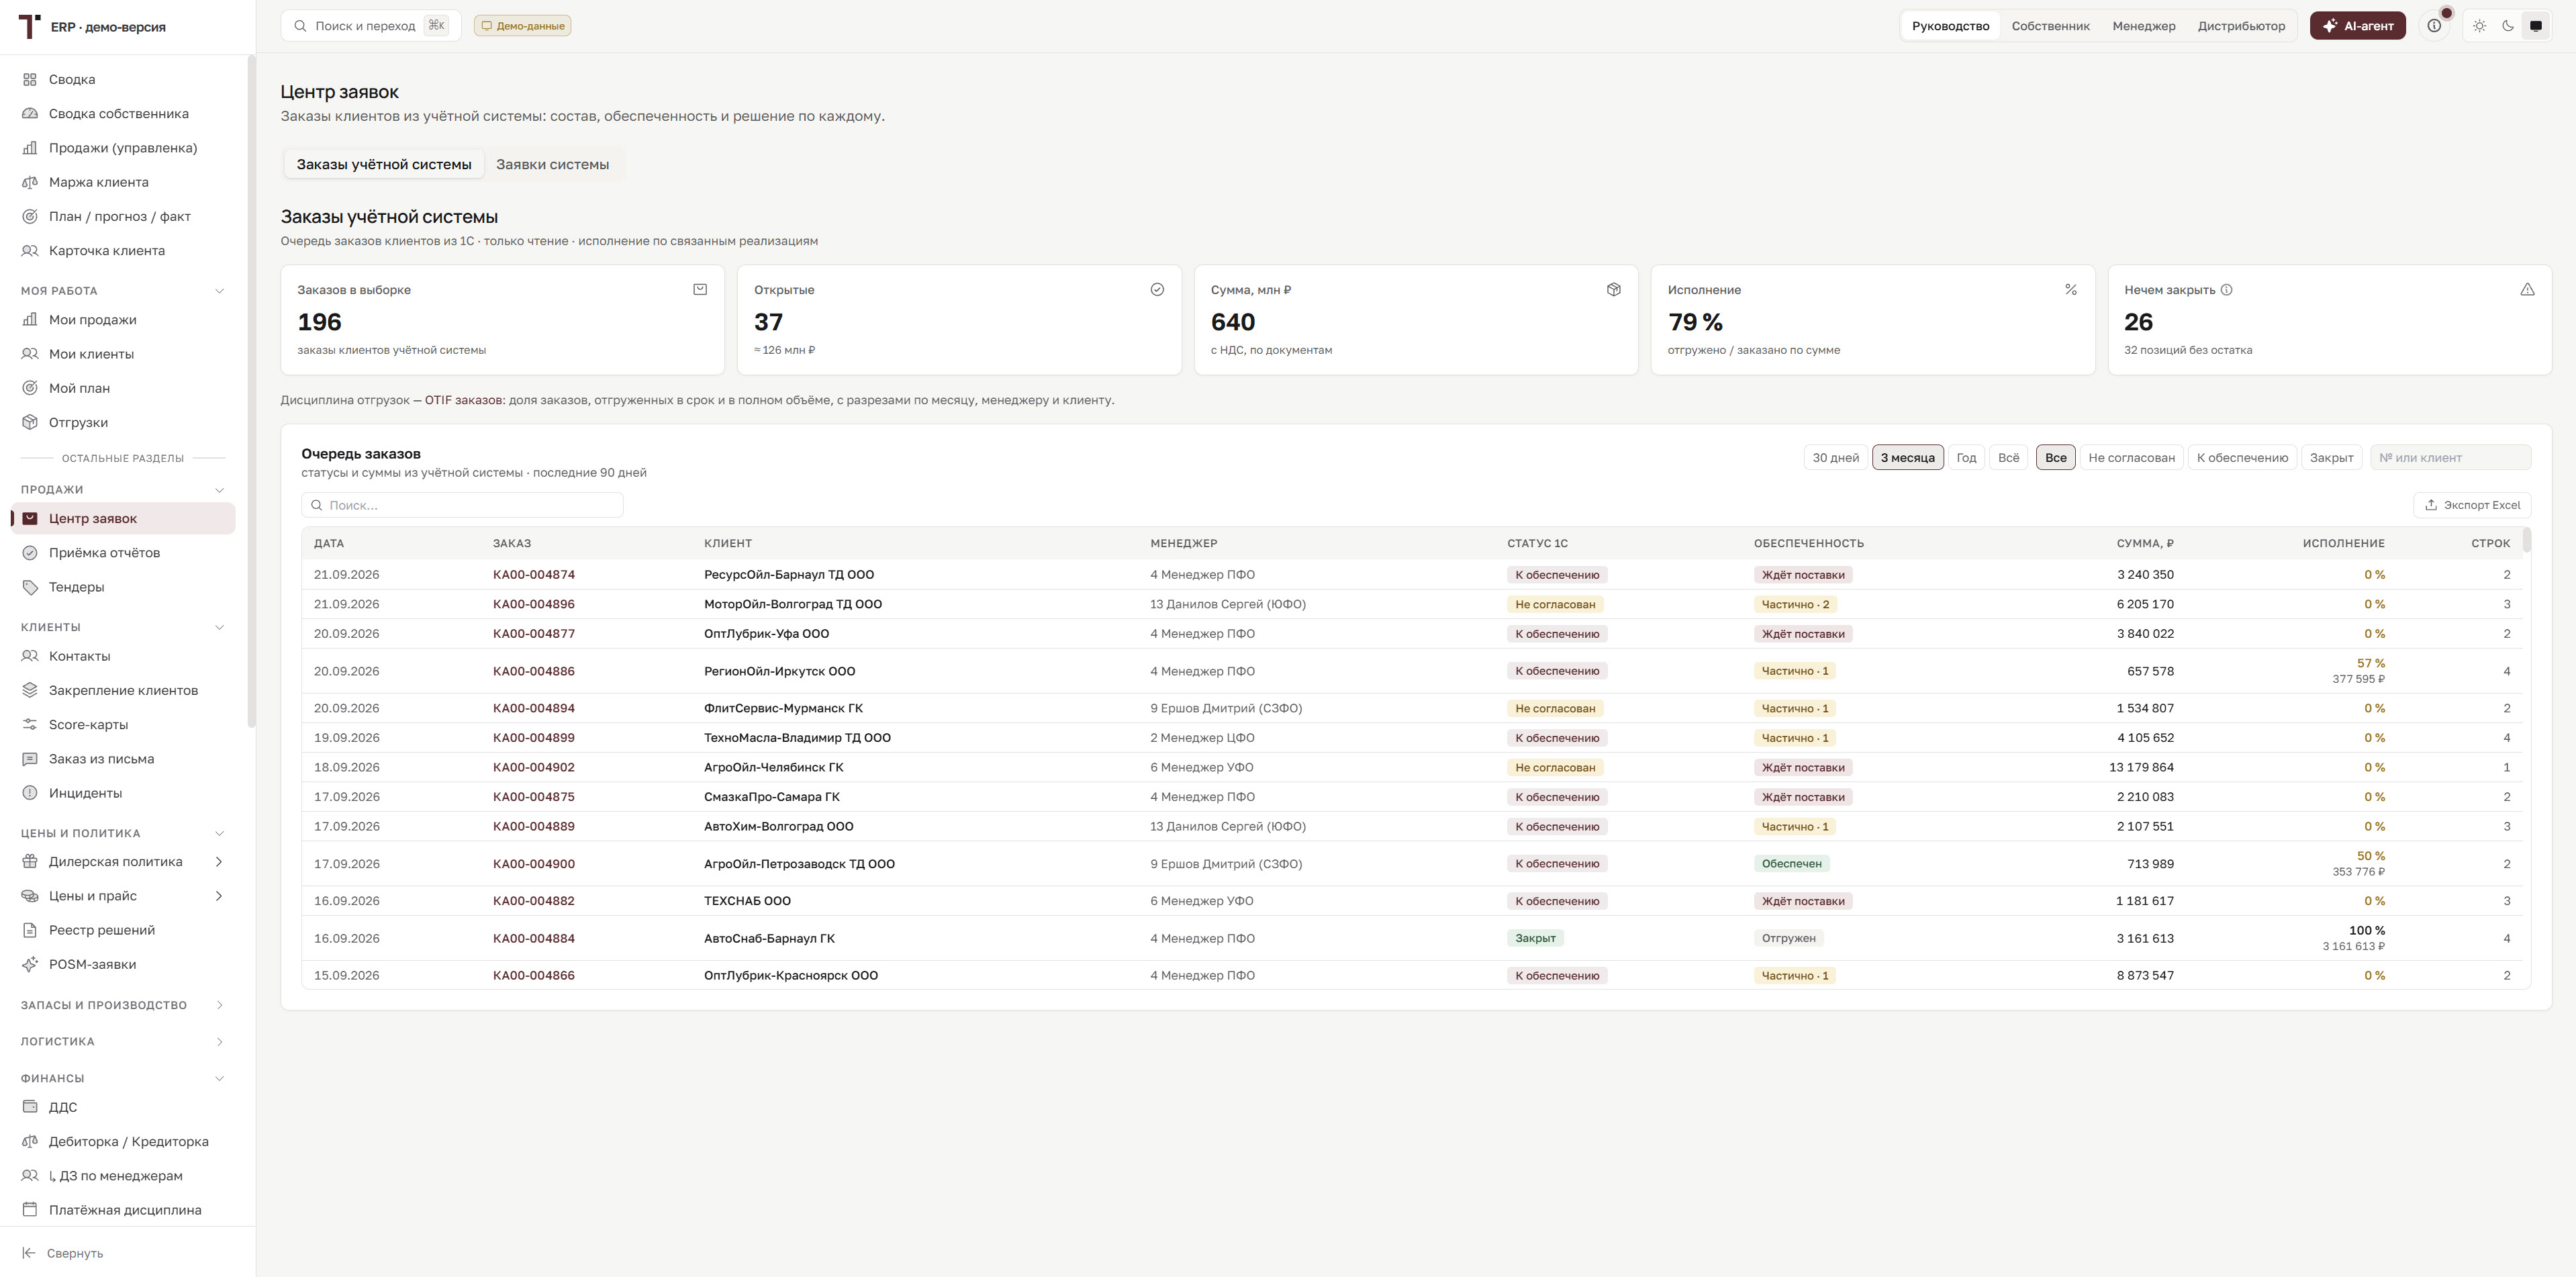
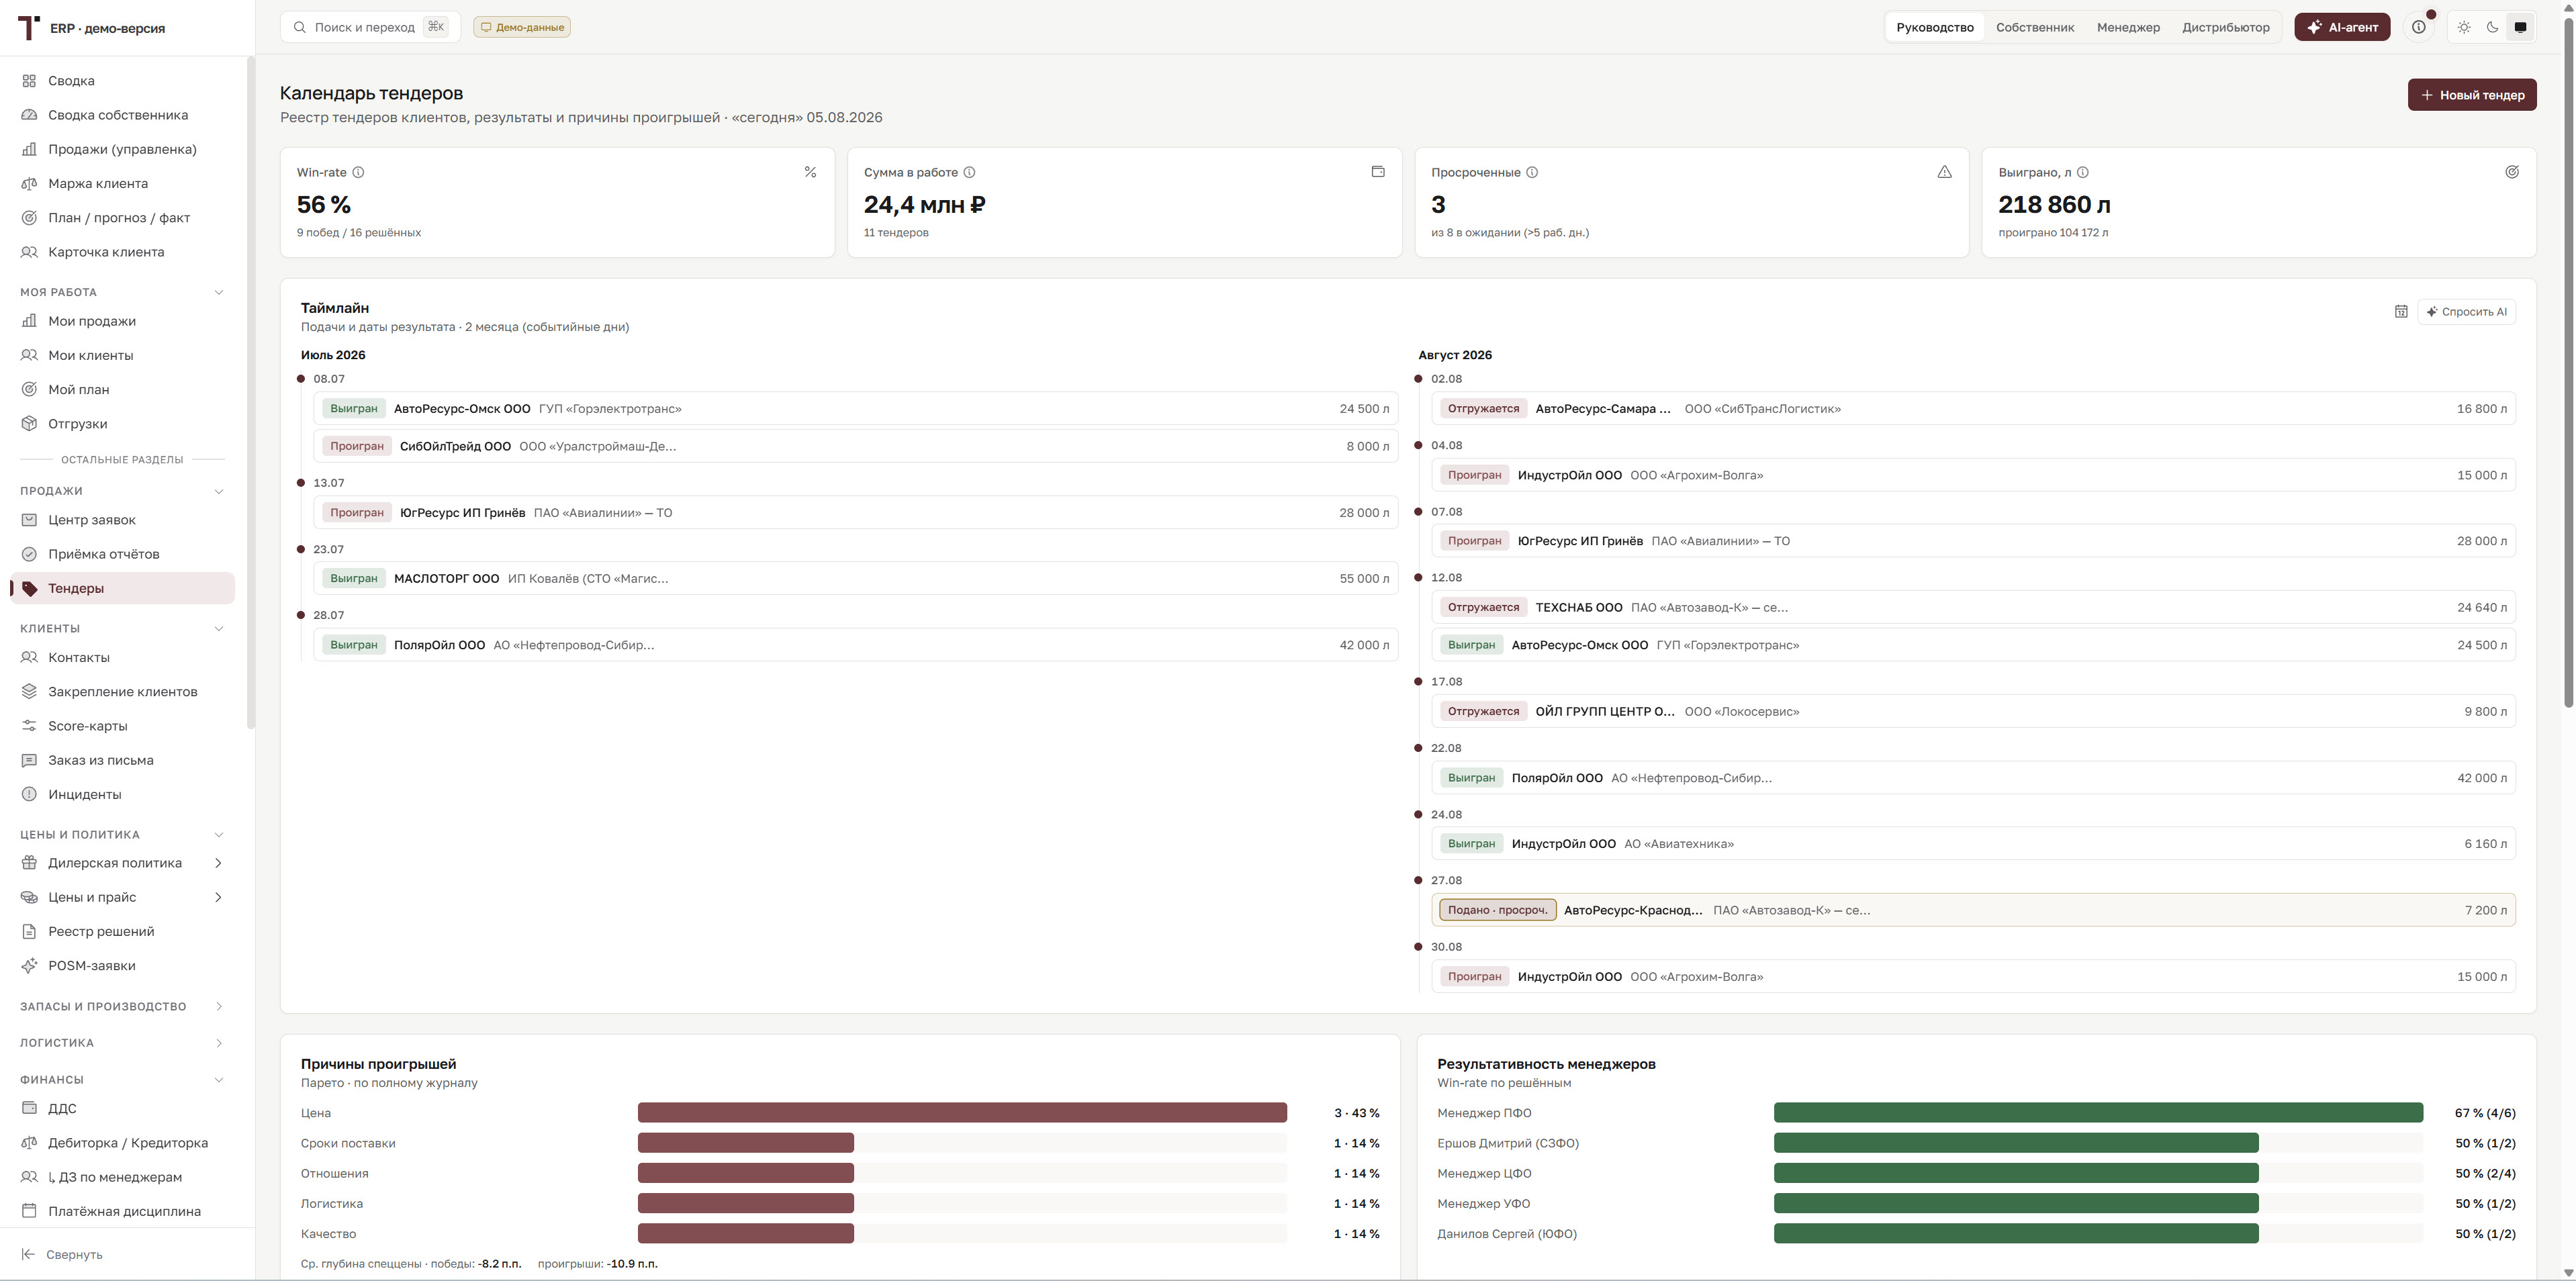
Today, our team is roughly halfway there. We have surveyed the key departments, described the main processes, designed the role-based access model and built the first working screens. The sales area runs on real data and is checked by the client every day. The system pulls data from 1C, links historical and current records, matches master data and calculates management metrics using agreed rules. Management can see sales, plans, receivables and payables, and the cash position on one screen. The commercial team gets analytics by business line, sales manager, customer and product. Sales managers see their own metrics and overdue receivables. The financial methodology is still being refined together with the client. The team is pulling together expense items, cost of goods, taxes and profit for management reporting. Every metric travels from its source in 1C to a check by the process owner. Still ahead: orders, order coverage, production, procurement, the lab, the warehouse and logistics.

The AI module of the ERP itself is planned for later stages. First, the system has to answer one question with confidence: “Where did this number come from?” Only then does it make sense to hand a digital assistant the job of finding deviations, explaining their causes and preparing recommendations. That said, AI is already part of the development process. Modern AI tools help the team work through interviews faster, structure requirements, compare document versions, explore large spreadsheets, prepare prototypes, write code and put together test scenarios. A developer can now test in a few hours a hypothesis that would once have taken several working days. Here, speed means more iterations with the client. The team builds a screen faster, shows it to the plant’s staff, gets feedback, refines the rule and releases the next version. AI speeds up the technical work, but responsibility for the architecture, the methodology and the final decisions stays with people. Every result is reviewed by our CTO, our project manager and the process owners on the plant’s side.
For me, the first professional result is already here. I came into the project thinking of ERP as a big program that brings a company’s data together. Now I see it differently: ERP is the codified logic of how people work together. It answers the questions: who makes the product, who makes the decisions, what rules an order follows, where responsibility lies and which data the company trusts. Code gives this logic its shape. The interface makes it visible. Integrations connect it to reality.
I’m 21, and this is my first digital product on this scale. The scale inspires respect, sometimes anxiety and often excitement. Now I have a way to keep moving forward: take one process, ask precise questions, check every conclusion and build the system step by step.
What the team did in the first two months
Over this period, from the initial idea to where we are today, our team at Intelligence Technologies ran a series of interviews, studied the processes of the key departments, designed the product architecture, built the role-based access model and got a working sales area up and running. We connected the ERP to two generations of 1C, set up regular data loads, matched customers, products, sales managers and plans, and built the owner’s dashboard and the working screens for the commercial team. The metrics are reconciled against the client’s reference reports within an agreed tolerance, and the working group’s feedback turns into system updates in short iterations.
Modern AI tools speed up analysis, design and development, which lets a small team keep up a fast pace and still dive deep into a company’s processes. In two months, the original dashboard has grown into a working foundation for the future ERP.
In the next article, I’ll tell you how our team went looking for a specification and, instead of the usual list of features, found fourteen stages in a single order. We’ll follow its journey from the customer’s first email to the plant gate and see why a digital system starts with a map of human responsibility.